ALWAYS CONSULT YOUR INVESTMENT PROFESSIONAL BEFORE MAKING ANY INVESTMENT DECISION

March 22, 2025 | Trading Desk Notes for March 22, 2025

Victor Adair


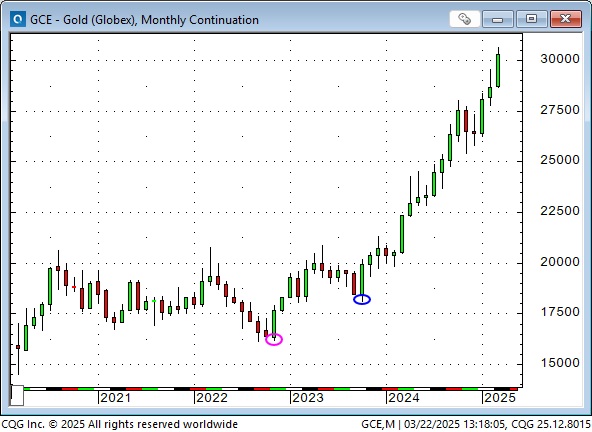
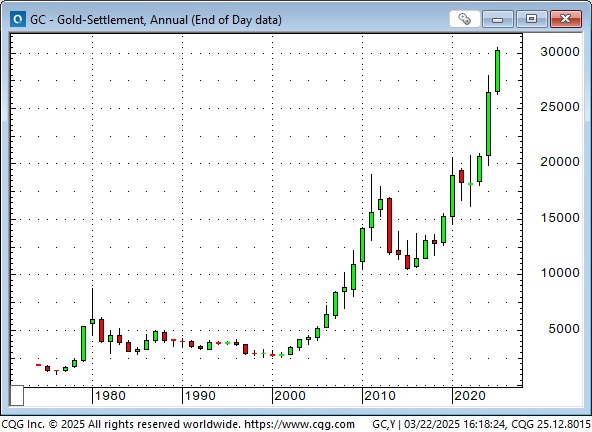
Gold hit new highs again this week, up ~$1,000 from year-ago levels
Front-month COMEX gold futures rallied to ~$3,065 this week, up over $400 (~15%) from the January 2025 lows, up ~$1,260 (~70%) from the pre-Hamas attack on Israel lows in October 2023 (blue ellipse) and up ~$1,450 (~90%) from the October 2022 lows (pink ellipse.)
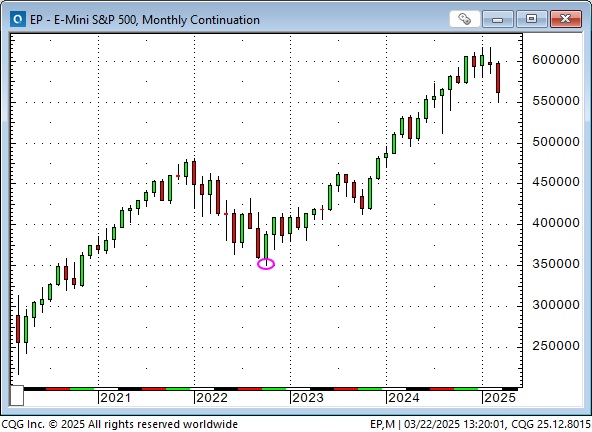
The S&P rallied ~75% from the October 2022 lows (pink ellipse) to the recent all-time highs, but gold rallied ~90% during that period.
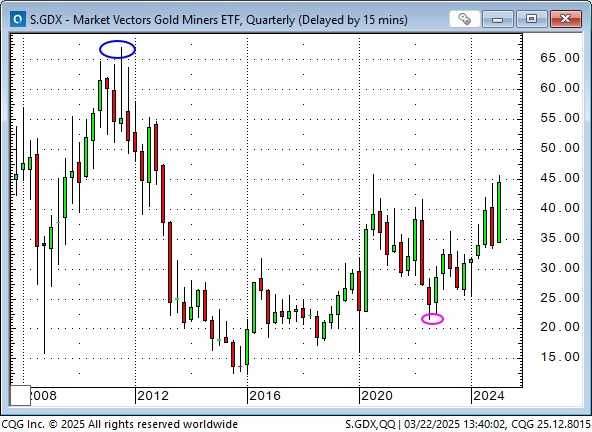
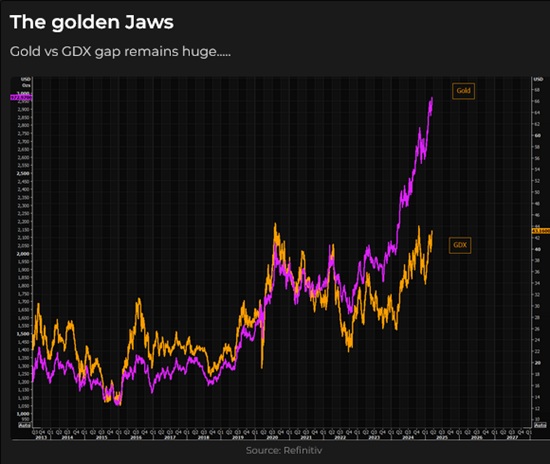
The gold miners ETF, the GDX, rallied to five-year highs this week, up ~110% from the October 2022 lows (pink ellipse). However, it is still well below the all-time highs reached in 2011 (blue ellipse), at the peak of the commodity market boom from 2009 to 2011, when COMEX gold reached a high of ~$1,900.
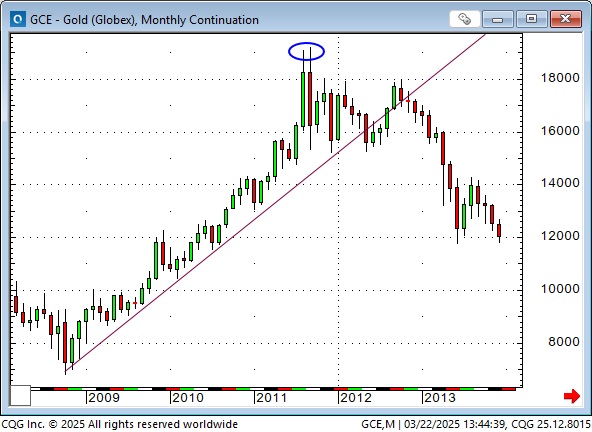
The 2009 to 2011 commodity boom.
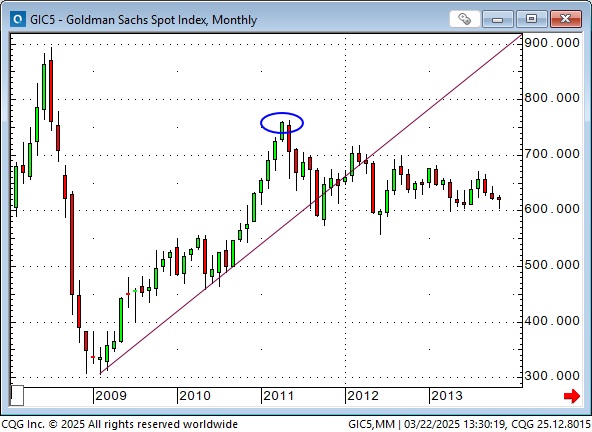
Gold rallied ~$1,200 (170%) during the 2009 to 2011 commodity boom, hitting a record high of ~$1,900.
Gold shares have underperformed their 2011 relationship with gold because there has recently been a much greater demand for possession of physical gold, especially by central banks. During the 2009 to 2011 period, central banks were net sellers of gold, averaging about 500 tonnes per year, while over the past three years, they have been net buyers, averaging ~1,000 tonnes per year. They want physical gold and they want it in their own vaults.
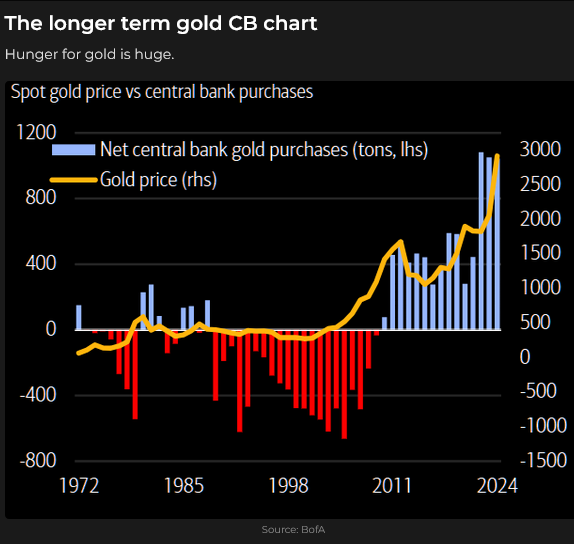
Issues specific to gold shares, such as country risk and questionable acquisitions, have caused them to underperform gold bullion over the last 15 years. Still, the primary reason for the underperformance is that the central banks, the biggest buyers in the market, want physical gold, not gold shares.
This chart shows the gold/GDX relationship from 2013 to now.
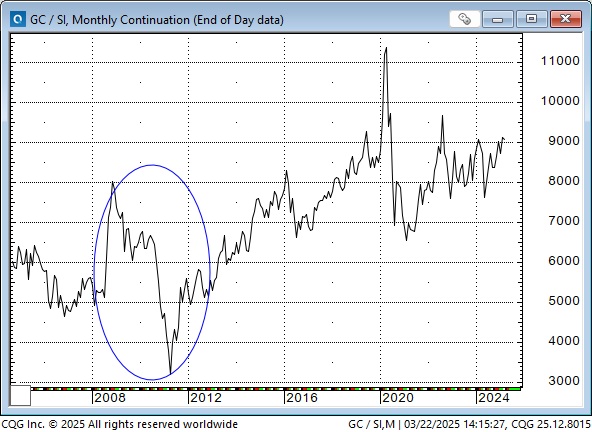
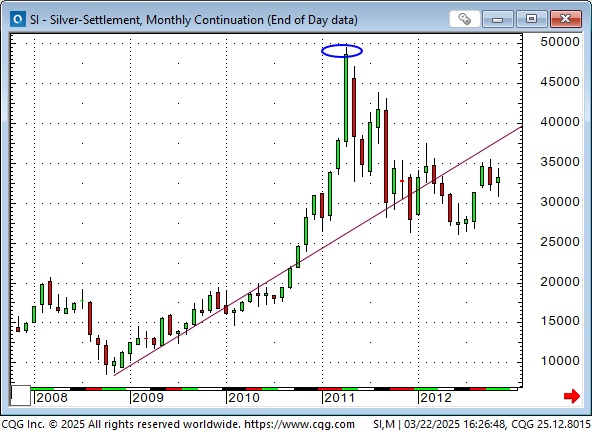
Silver has also underperformed gold over the last 15 years. During the 2009 to 2011 commodity bull market (blue ellipse), silver hugely outperformed gold, and at the peak of the rally in 2011, it took only ~30 ounces of silver to buy one ounce of gold. Recently, the ratio has been ~90 to 1.
Silver rallied 4X (from ~$10 to ~$50) in the 2009 to 2011 commodity boom.
Current US official gold reserves (stored at Fort Knox and other locations) are estimated at ~8,133 metric tons or 261 million troy ounces, worth ~$780 billion at US$3,000 per toz. In 1941, total reserves were estimated at 20,260 metric tons, or ~650 million troy ounces, which was ~80% of global official gold reserves at that time. Those reserves were diminished over the years when other countries delivered US banknotes to America in exchange for gold at $35 per ounce. US President Richard Nixon closed the “gold window” in August 1971, and the USA stopped exchanging gold for US Dollars. See “Three Days at Camp David” by Jeffrey Garten.
The World Gold Council estimates “that around 216,265 tonnes of gold have been mined throughout history. Interestingly, about two-thirds of this gold has been extracted since 1950.”
Assuming “very little” of that global gold supply has been lost, it will have a “market cap” of ~$21 trillion, and American official gold reserves will be less than 4% of that “market cap.” For perspective, the current market cap of the S&P 500 is ~$49 trillion.
Volatile price action in gold
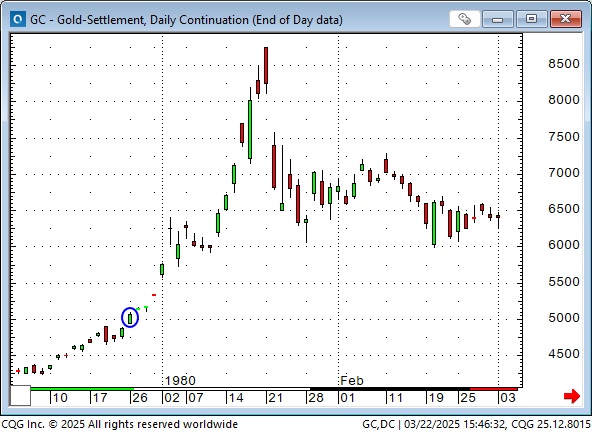
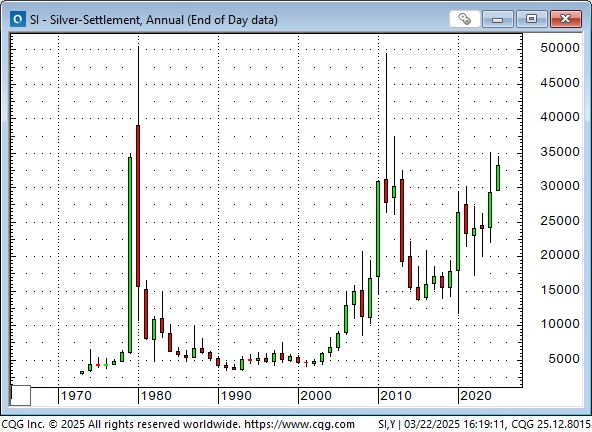
Russia invaded Afghanistan on December 24, 1979 (the blue ellipse is December 27), with gold at all-time highs of ~$500. By Monday, January 21, 1980, COMEX gold had soared to a high of $875, but five trading days later, it dropped to ~$600. (A drop of $275 was worth $27,500 per 100 ounce contract.) COMEX gold did not trade above $875 for the next 28 years until January 2008.
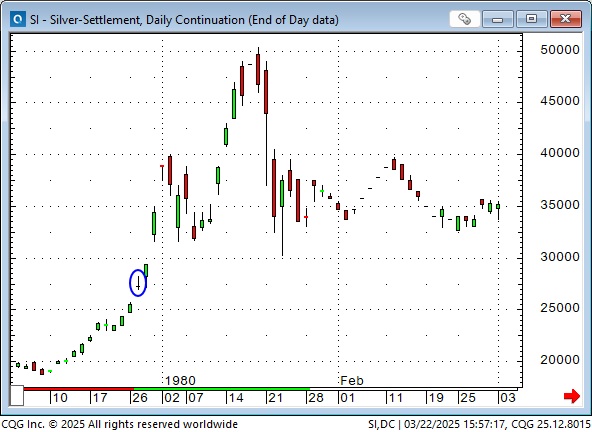
COMEX silver (a 10,000 troy-ounce contract at the time) traded at ~$27/28 on December 27 (blue ellipse) but soared to ~$50.36 by Friday, January 18, 1980. Over the weekend, COMEX decided on a “liquidation only” order for non-commercial accounts, and the price collapsed to around $37 on Monday and was as low as $30 on Wednesday, January 23. (A drop of $20 was worth $200,000 per 10,000 ounce contract.) In my opinion, the collapse of the silver market in 1980 broke the gold bull market. Front-month COMEX silver never traded above its January 1980 highs, although it came close in April 2011 (at the peak of the 2009 to 2011 commodity bull market) at $49.50.
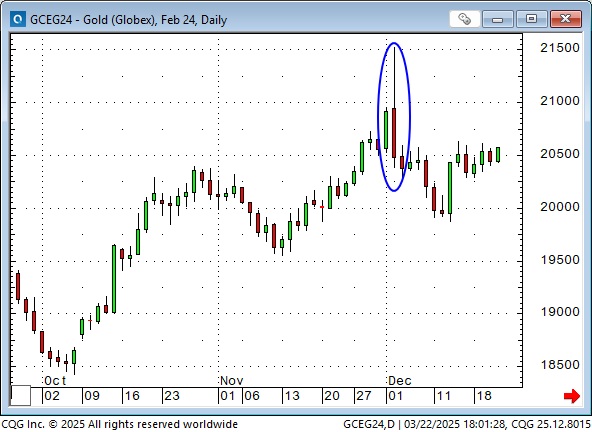
On Sunday evening, December 3, 2023 (Monday morning Asian time), February COMEX gold soared ~$60 within the first hour of trade to an All-Time High of ~$2,152. By mid-day Monday (blue ellipse on the chart below), it was down ~$115 from the overnight highs; at the end of the week, it was down ~$140, creating a weekly Key Reversal down on the charts.
The previous week, front-month COMEX gold futures closed at a record weekly high of ~$2,073 on Friday, December 1. “Somebody” hit that market HARD on Sunday evening, selling thousands of contracts. If it had been a currency market reaching record highs and then getting hit like that, traders would have assumed “official intervention.”
The selling was well timed if there was an “intention” to get the price down because net speculative positioning was the most net long since the Russian invasion of Ukraine in February 2022, and some of those speculators would have turned sellers as the price fell dramatically.
Current situation
Front-month COMEX gold had a record-high weekly close above $3,000 this week, roughly $1,000 above its record-high weekly close on December 1, 2024. Net long speculative positioning is near record highs, about 30% higher than in December 2023, reflecting bullish sentiment. Is the market vulnerable to a break?
I’ve traded gold for over 50 years, and I remember when it was less than $100 an ounce. I believe there are people in all the markets I trade that I will never know. I don’t know what they know, who they know, what they believe, their motives, their time frame, or how much money they control, so I tread cautiously.
Good old stuff
The Winnipeg Commodity Exchange started trading gold futures on November 16, 1972. As the NYT reported that day, US citizens could not trade in gold futures under the same regulations that prohibited their owning gold. (Those regulations ended at the end of 1974, and US citizens could legally own gold for the first time in 41 years.) The Winnipeg contract size was 400 troy ounces. The first sale, for January 1973 delivery, was $62.50. The day’s total volume was 70 contracts.
My short-term trading
I’ve been looking for a short-term bounce in the S&P and have been a buyer (with mixed results) over the past eight trading sessions. I’m long going into this weekend.
I’ve also been shorting the Yen (with mixed results), and I’m short going into the weekend.
Thoughts on trading
I’m going to miss more “good moves” than I catch.
The “80/20” trading rule, which states that 80% of your net profits will come from 20% of your trades, is probably closer to a 90/10 ratio.
Getting a better risk-reward ratio will probably require me to trade with a longer time frame.
On my radar
April 2: Liberation Day for America.
The Barney report
Here’s Barney patiently waiting at the top of the steps to my office, knowing that sooner or later, I’ll finish writing this week’s notes and take him for a walk.

Listen to Mike Campbell and I discuss markets
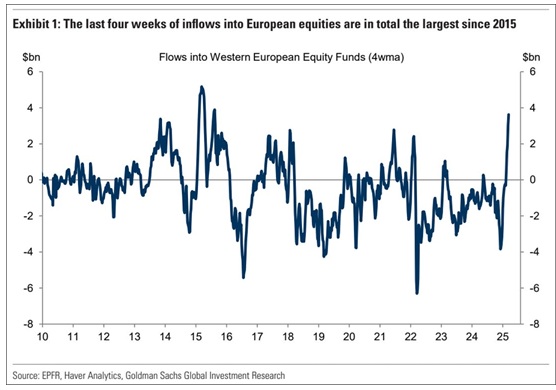
On this morning’s Moneytalks show, Mike and I discussed gold, stocks, currencies and crude oil. I proposed that the enthusiasm for the “new European Era” that has seen capital flow to Europe and the Euro is probably overdone. You can listen to the show here. My spot with Mike starts around the 60-minute mark.

The Archive
Readers can access weekly Trading Desk Notes from the past eight years by clicking the Good Old Stuff-Archive button on the right side of this page.
Subscribe: You have free access to everything on this site. Subscribers receive an email alert when I post something new, usually four to six times a month.
Victor Adair retired from the Canadian brokerage business in 2020 after 44 years and is no longer licensed to provide investment advice. Nothing on this website is investment advice for anyone about anything!
STAY INFORMED! Receive our Weekly Recap of thought provoking articles, podcasts, and radio delivered to your inbox for FREE! Sign up here for the HoweStreet.com Weekly Recap.
Victor Adair March 22nd, 2025
Posted In: Victor Adair Blog