March 31, 2025 | The Human QE Hangover

Happy Monday Morning!
As we learned last week, Canada’s population surge has come to an end. Population growth rose by just 0.15% last quarter, which outside of the 2020 lockdowns was the slowest quarter for population growth since 2017. For the first time in three years, the non-permanent resident cohort outright contracted.
More importantly, if the Feds actually follow through with their promise (we remain skeptical for reasons stated below) non-permanent residents will continue to contract, with the stated goal of getting that cohort down from about 7% of the total population to just 5%.
Human QE was one hell of a drug, and now comes the hangover.
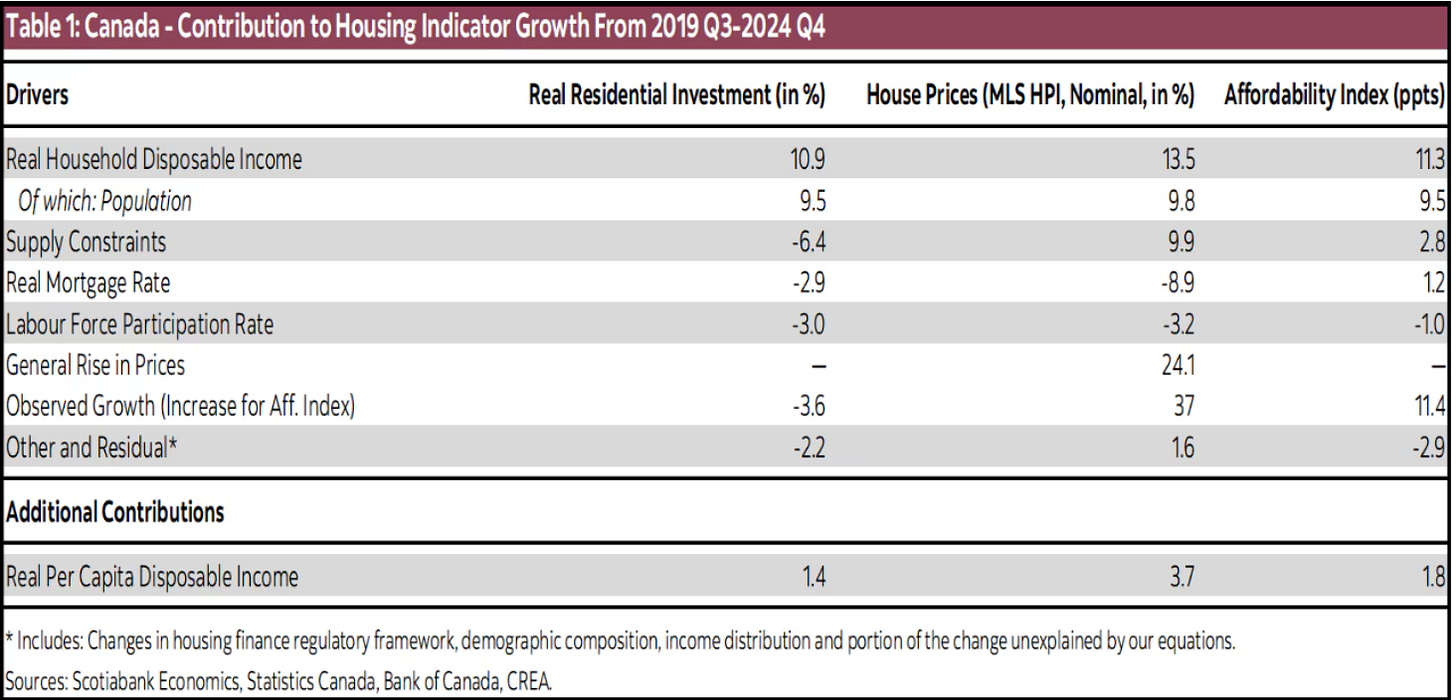
According to a recent report from ScotiaBank, which has attempted to quantify the levers that exacerbated the housing crisis, suggests that the surge in immigration contributed to more than 80% of the deterioration in affordability conditions since 2019.
Per Scotia, the table below shows the contribution of key drivers of housing demand along with our indicator of supply conditions over the period 2019Q3 to 2024Q4. From our estimates, the national housing market was relatively balanced in 2019Q3 with levels of residential investment and the home price index consistent with housing market fundamentals. Hence we use this quarter as the base period.

A first takeaway from the table is the impact the tightening in supply constraints since 2019 has had on the reported housing indicators, notably the home price index and affordability conditions. This tightening lifted the national home price index by 9.9% from 2019Q3 to 2024Q4, meaning that if supply constraints had stayed unchanged over this period, the benchmark home price in 2024Q4 would have been close to $667,500 instead of the about $719,400 posted for that quarter, a $52,000 difference. And these tighter supply conditions contributed to deteriorate affordability by raising the index by 2.8 percentage points over the same period, hence responsible for close to one-third of the deterioration in this index.
Another highlight from the table is the contribution from above-normal population growth—especially since 2022. Over this period, it lifted the home price index by 9.8%, or about $51,500. Now accounting for the impact of population growth on the home price index and mortgage rates—the latter from the channel described earlier—we estimate that rising population contributed to more than 80% of the deterioration in affordability conditions since 2019 (or 9.5 percentage points of the observed 11.4 increase).
Ouch.
Economic models are far from perfect so let’s take these numbers with a grain of salt. However, it doesn’t take a PhD to understand that adding 1.2 million new people and only building 200,000 new homes isn’t going to end well.
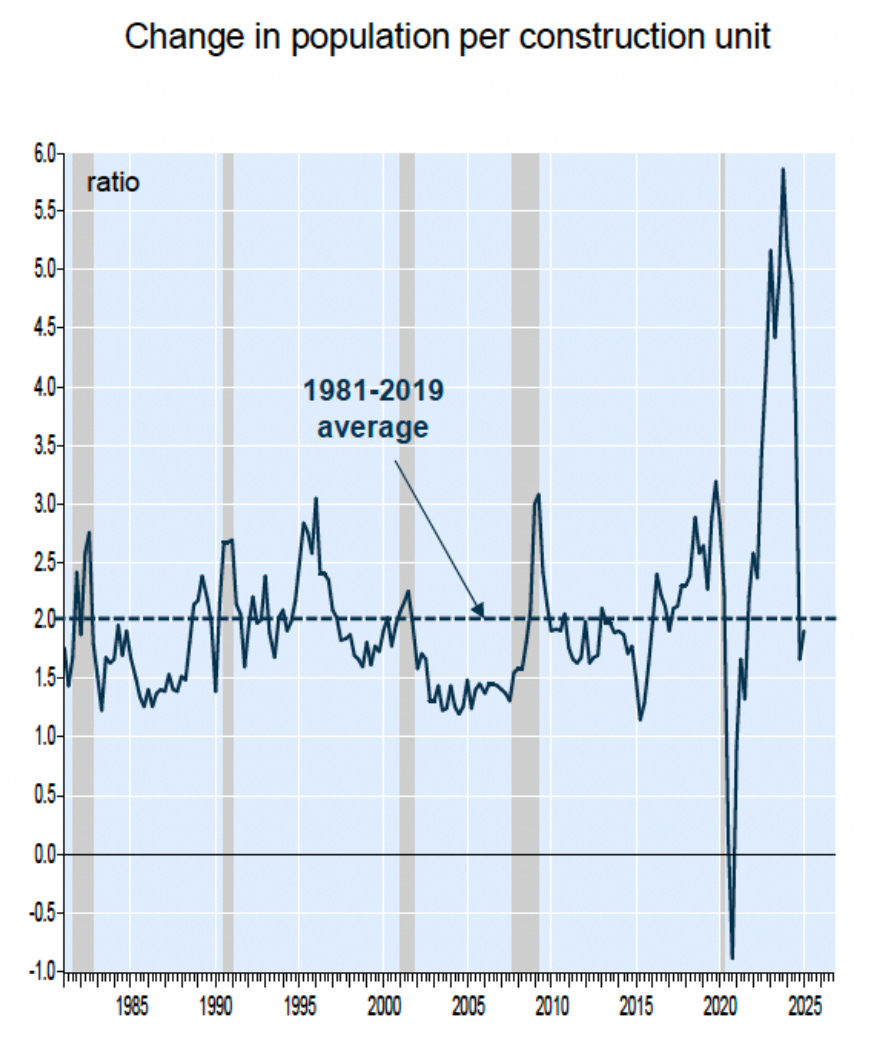
Now that population growth is running at 7 year lows, the housing market is catching a breather. Per National Bank, the population increase per construction unit has returned to its 1981-2019 historical average of 2.

Like we said, nature is healing, but the abrupt change in policy and market conditions comes with a painful adjustment period. House prices and rents are now rolling over and so is the speculative froth that accompanies record house price inflation. Suddenly there is an abundance of investor condos hitting the market and pre-sale activity has collapsed.

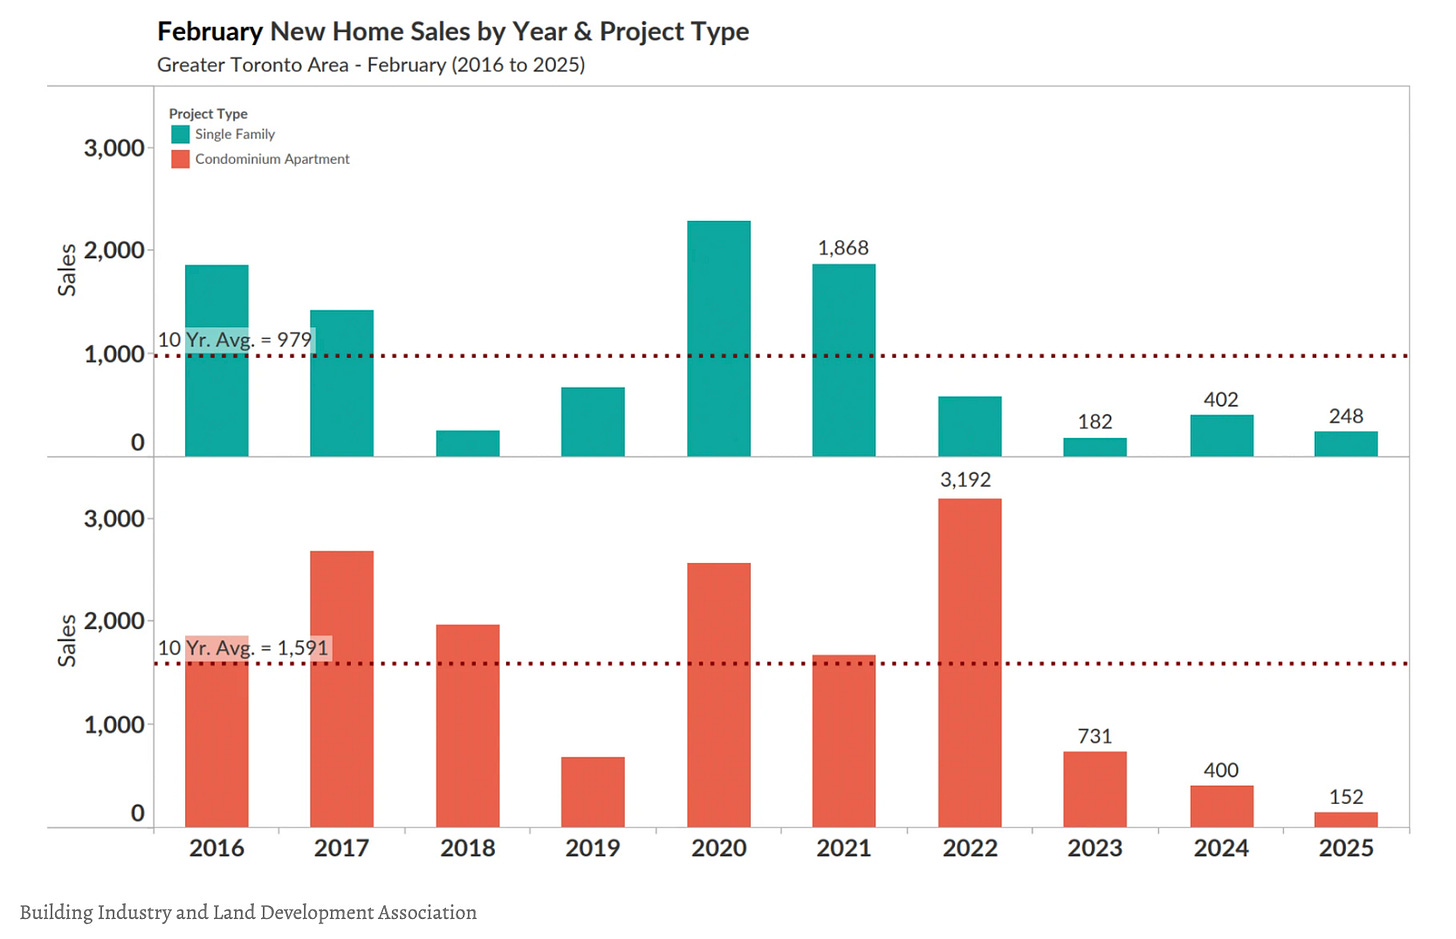
New home sales in the GTA hit unprecedented lows, with only 400 transactions recorded in February — a 50% year-over-year decrease. For context, a typical February, based on the 10-year average, would see around 2570 new homes sales, so February’s sales are down about 84%.

But the weak month isn’t a one-off. Sales hit record lows multiple times in 2024, and December closed out the year with the lowest new home sales seen in 40 years.
“Make no mistake, we are at the point of a serious ‘cost to build’ crisis and we risk an entire industry shutting down with great and lasting consequences to housing supply and affordability in the GTA,” said Justin Sherwood, Senior Vice President of Communications, and Research at BILD.
If you’re wondering why politicians have recently unveiled mortgage insurance on homes up to $1.5M, the removal of GST, the removal of the capital gains hike, and the sudden change of heart around development fees, now you know why.
Unfortunately it might be too late to reverse course.
Economic mismanagement comes at a cost, and its one that we will all pay.
STAY INFORMED! Receive our Weekly Recap of thought provoking articles, podcasts, and radio delivered to your inbox for FREE! Sign up here for the HoweStreet.com Weekly Recap.
Steve Saretsky March 31st, 2025
Posted In: Steve Saretsky Blog
Next: Ice Storm For The Ages »


