December 30, 2024 | Santa Missing as S&P 500 Trends Lower

So far, the much-anticipated Santa Claus rally has failed to materialize, and time is running out for a year-end market boost.
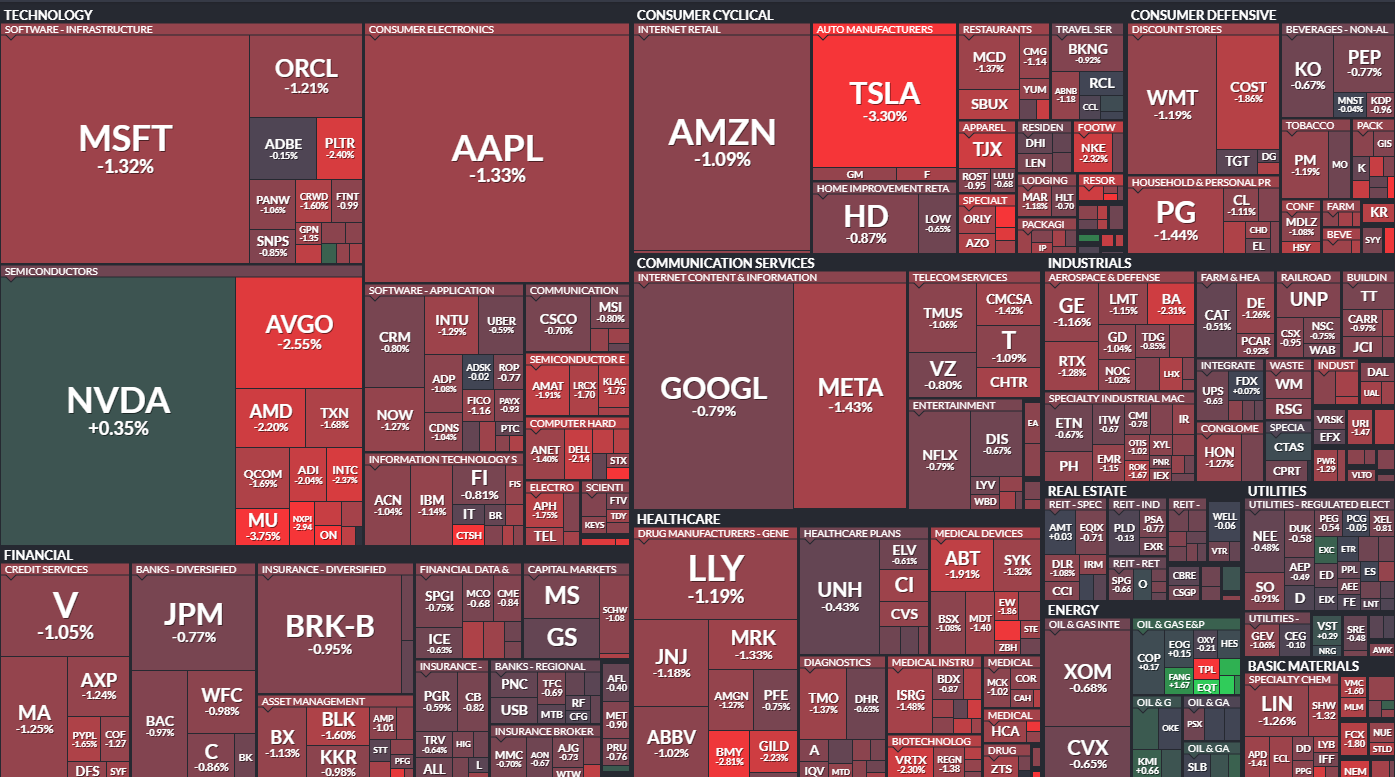
The S&P 500 heat map painted another grim picture, with most sectors deep in the red. However, Nvidia managed to eke out a slight gain, and the oil sector showed some resilience. Outside of those bright spots, the broader market remained under pressure.

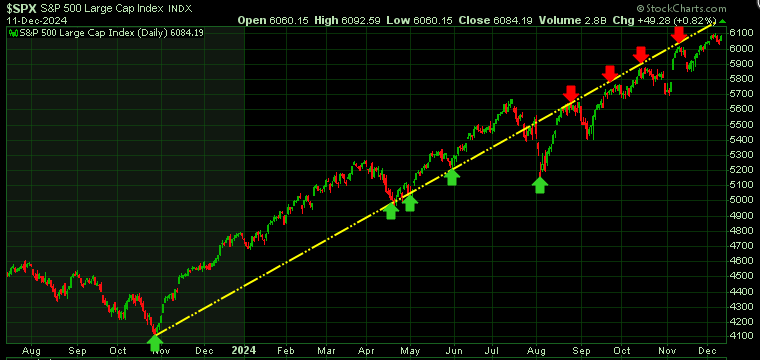
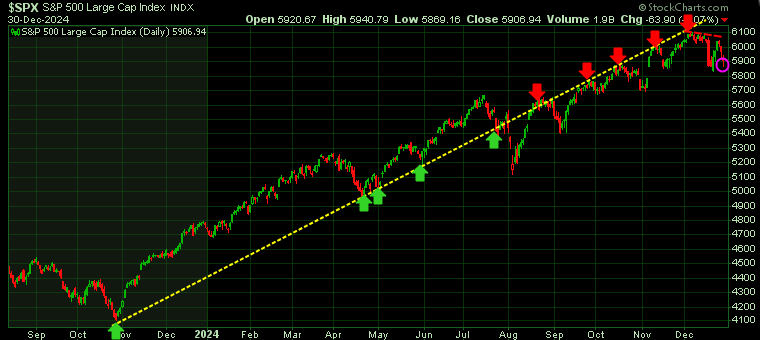
Back on December 11/24, we highlighted a critical technical trend we’ve been closely monitoring. We drew a yellow trend line extending from October 2023 to that date. Up until August of this year, every time the S&P 500 tested this trend line, it held (indicated by green arrows), and the market subsequently moved higher. However, since August, this same trend line has acted as resistance, and each test has resulted in a reversal lower (indicated by red arrows).

Today, as we revisit that chart, it’s clear that the S&P 500 has been unable to break through this yellow resistance line and continues to trend downward.

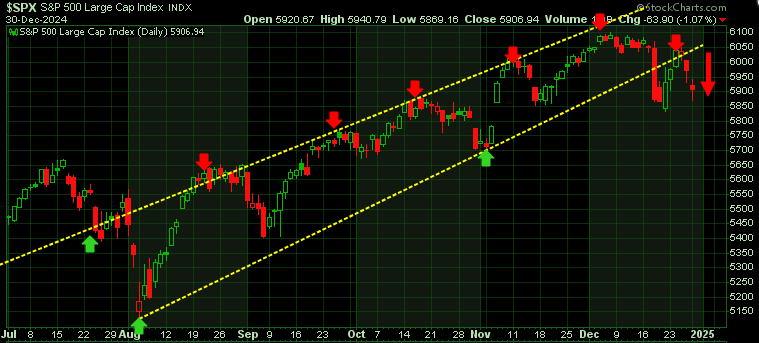
Zooming in for a shorter-term perspective, we can see more clearly how the index has fallen out of the uptrend wedge channel it had been tracking since August. On December 18th, the S&P 500 broke below the lower boundary of that channel. A brief retrace on December 24th was swiftly rejected, and the market has been trending lower ever since.

We have consistently warned our subscribers about potential market challenges in the early months of 2025. If the S&P 500 cannot regain its position within the uptrend wedge channel in the coming days, January could prove to be a particularly difficult month for equities.
Stay tuned!
STAY INFORMED! Receive our Weekly Recap of thought provoking articles, podcasts, and radio delivered to your inbox for FREE! Sign up here for the HoweStreet.com Weekly Recap.
Martin Straith December 30th, 2024
Posted In: The Trend Letter


