October 27, 2024 | An Election Week Scenario

You can always tell when portfolio managers are hard at play, immersed in an epic circle jerk that has become more tediously familiar with each passing week. And so it went on Friday, as money migrated for no discernible reason from certain, temporarily disfavored stocks to flavor-of-the-day hotties. It seemed almost as though the chimpanzees who purport to manage everyone’s money were on a conference call that morning, scripting a narrative simple enough for Jim Cramer to shill to widows and pensioners addicted to his show. The Dow was down more than 300 points at its lows, even as the lunatic-sector stocks — you know them as the idiotically misnamed ‘Magnificent Seven’ — winked at the thrashing their poor cousins were getting on less sexy exchanges. The Naz was borne aloft as always by light volume and timid resistance. Bears evidently were too gutless to resist the uptrend, which in recent weeks has become increasingly confident of a Trump victory.
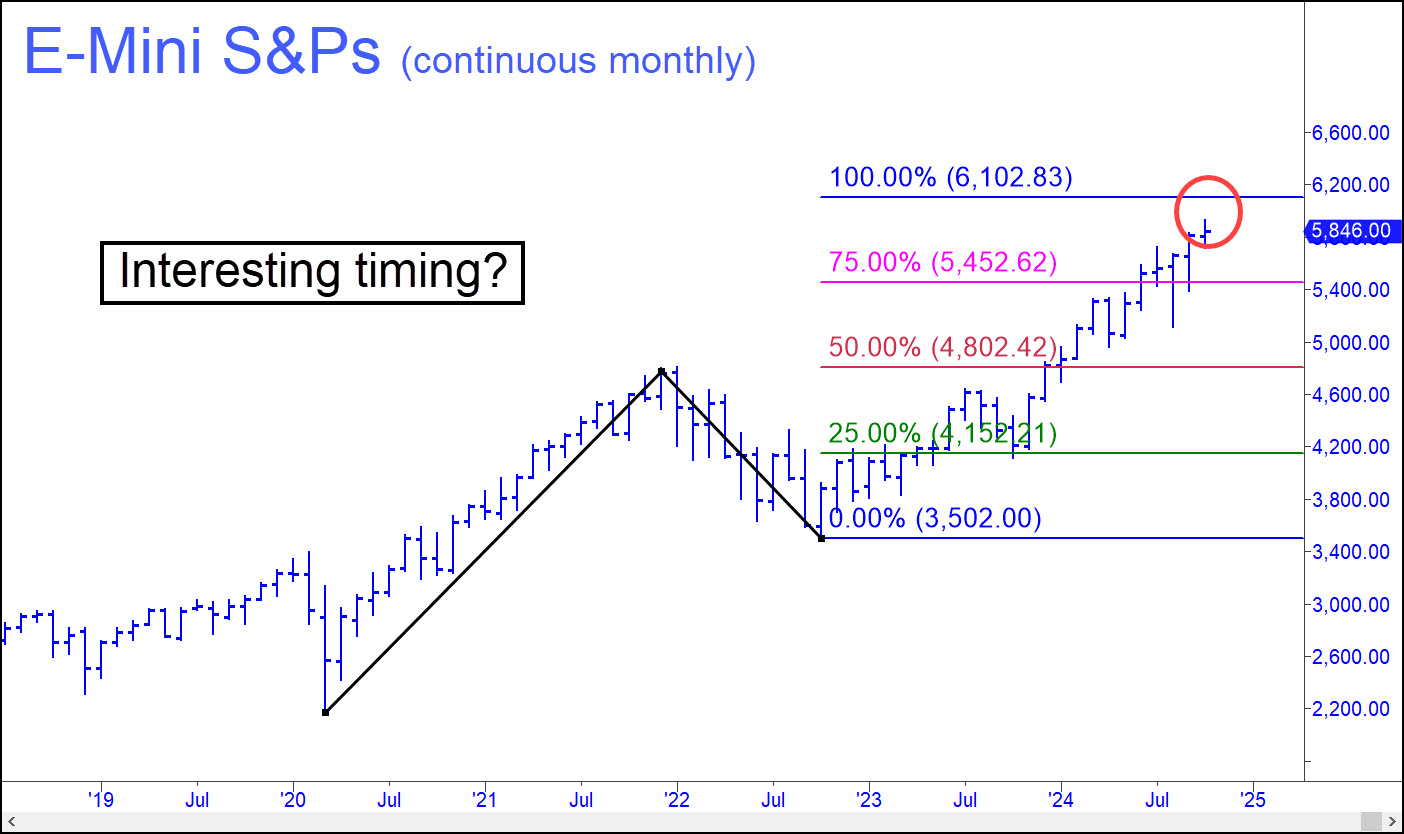
4% Above Sits Trouble
Even so, there is a palpable feeling that the stock market has been nutso for so long that it’s overdue for a sea change. That could mean irrational exuberance will peak on or around election day. But Mr Market could also surprise with a rally that turns even steeper than the one that has stripped the flesh from sane observers and skeptics with propwash.
So which? The chart above makes a compelling case for something in-between. The 6102 S&P target lies 256 points, or 4.4%, above Friday’s close. It would not be as large a gain in points as occurred in August or September. However, if the top were to coincide with the November 5 election, the entire gain would have occurred in just seven trading days. That looks like a good bet, but I would not recommend sticking around for the rest of the week as toga fever rages on Wall Street. The chart says clearly that a big move into election day could be a bull trap and therefore a time for extra caution. Please note that the target will not likely work precisely because it comes from a blended, continuous chart. Even so, it can be expected to show stopping power at or very near 6100.
STAY INFORMED! Receive our Weekly Recap of thought provoking articles, podcasts, and radio delivered to your inbox for FREE! Sign up here for the HoweStreet.com Weekly Recap.
Rick Ackerman October 27th, 2024
Posted In: Rick's Picks


