September 11, 2024 | Chart Alert: Double Top Resistance Signals Potential for Sharp Decline

This is an important chart!

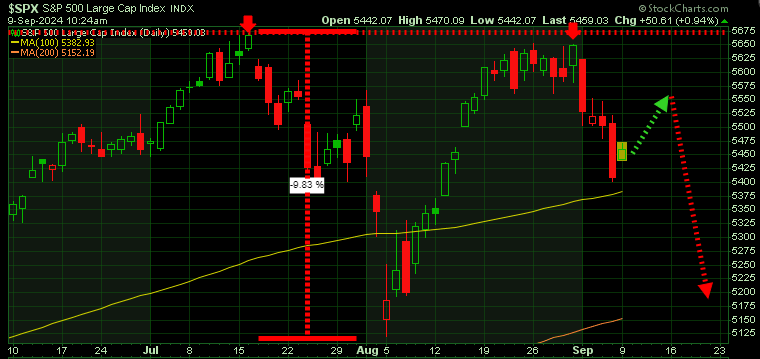
The S&P chart reveals two critical outside reversal weeks down from the 5,700 level—the first ending July 19th and the second just last week, on September 6th. These consecutive reversals in such a short time frame have created a powerful double top resistance.
After the July 19th reversal, we saw a retracement rally to 5,630 before plunging 500 points (~10%) to 5,100 over the next three weeks. We want to caution investors that a similar pattern is very much in play now. Following last week’s reversal, there’s potential for a bounce to around 5,550, but don’t be surprised if that rally falters.
If we reach that 5,500 level, be prepared with your hedging strategies, as the S&P could easily test its 200-day moving average near 5,150. Head on a swivel!
Stay tuned!
STAY INFORMED! Receive our Weekly Recap of thought provoking articles, podcasts, and radio delivered to your inbox for FREE! Sign up here for the HoweStreet.com Weekly Recap.
Martin Straith September 11th, 2024
Posted In: The Trend Letter


