ALWAYS CONSULT YOUR INVESTMENT PROFESSIONAL BEFORE MAKING ANY INVESTMENT DECISION

August 10, 2024 | Trading Desk Notes for August 10, 2024

Victor Adair


Mean reversion was nasty on Monday, but mellowed by Friday
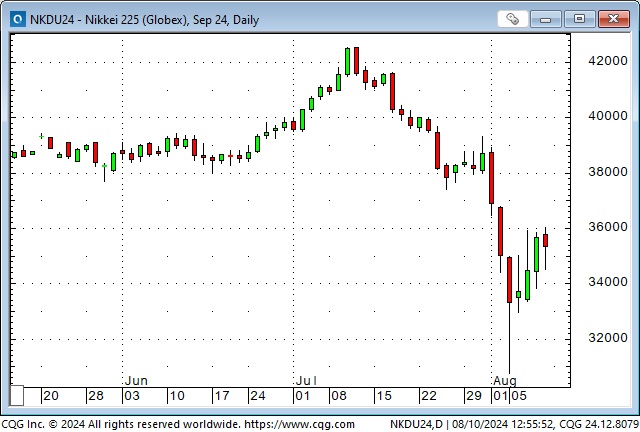
The Nikkei plunged to a 10-month low on Monday, down ~28% from July’s record highs and down ~20% in three trading days (the sharpest decline since the crash in October 1987.) By Friday’s close, the Nikkei had rebounded ~15% to close slightly higher on the week.
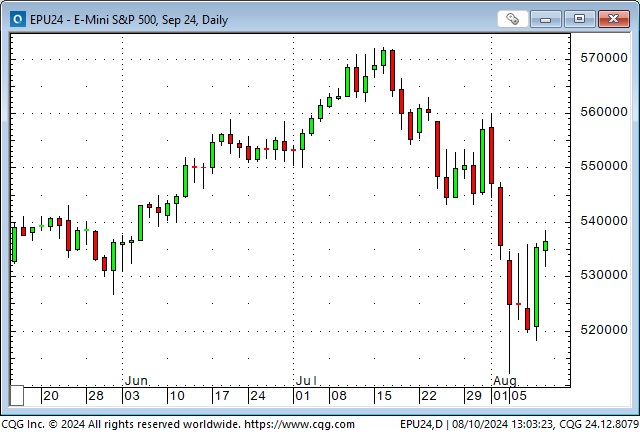
The S&P chart had a similar pattern. It fell to a four-month low on Monday, down ~10.5% from July’s record highs and 9% in three trading days. By Friday’s close, the market had rebounded ~5% to close slightly higher on the week.
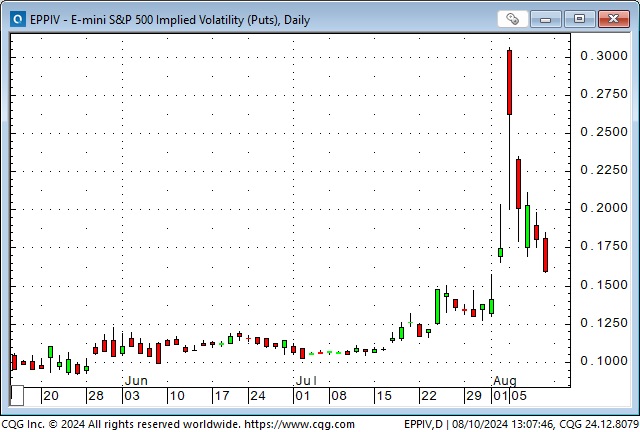
Implied VOL on S&P futures spiked to a 4-year high on Monday but quickly fell back and closed lower week over week.
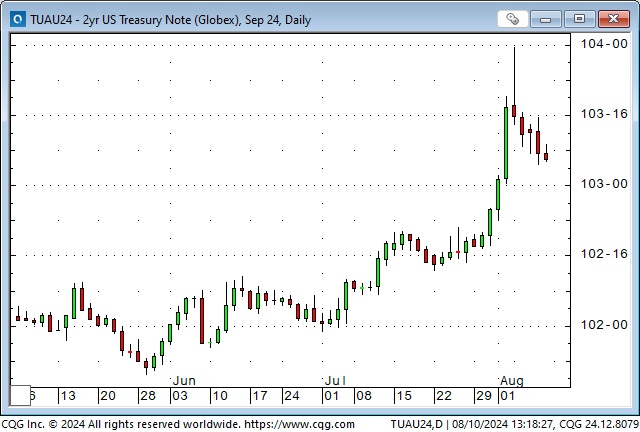
Two-year Treasury prices spiked to a 2-year high on Monday, then reversed sharply to close lower on the week. (Yields dropped to ~3.66% on Monday and rebounded to ~4.06% at Friday’s close.)
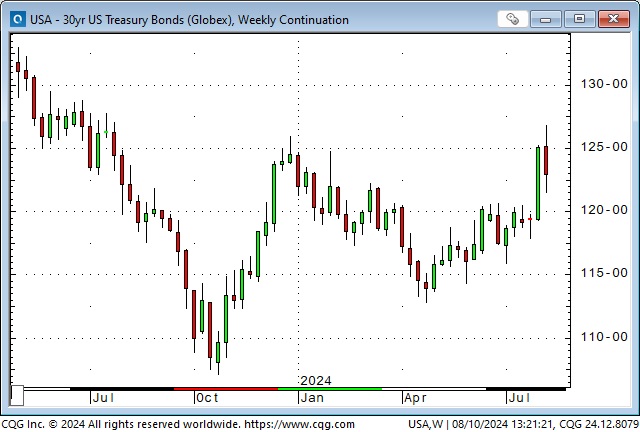
The long bond spiked to a 1-year high on Monday but closed down on the week.
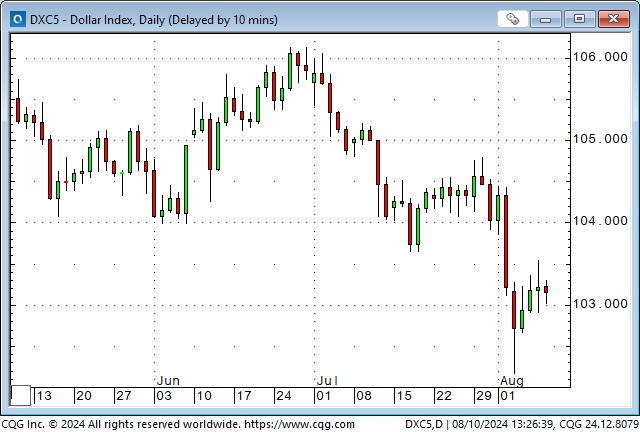
The US Dollar Index fell to an 8-month low on Monday, down ~4% from June’s highs, but rebounded to close nearly unchanged on the week.
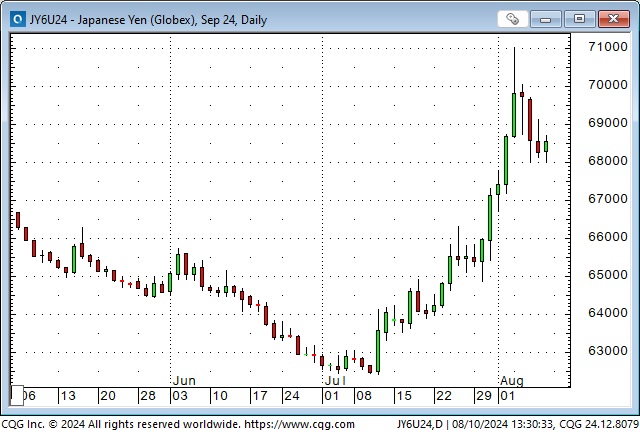
The Yen rallied to an 8-month high on Monday, up ~14% from July’s 35-year lows, then fell to close slightly lower on the week. In early July, speculators held a massive net short position in the Yen – the largest on record. By Tuesday, August 6, speculators were flat, having covered that massive short position as the Yen rallied. The short-covering helped fuel the rally.
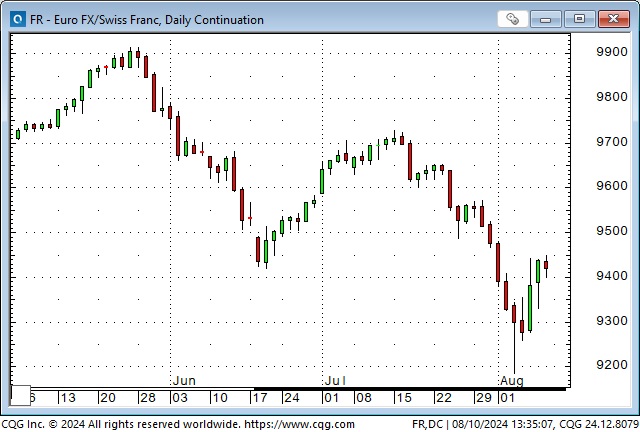
The Euro/Swiss (my favourite barometer of European stress) fell to all-time lows on Monday but rebounded to close higher on the week.
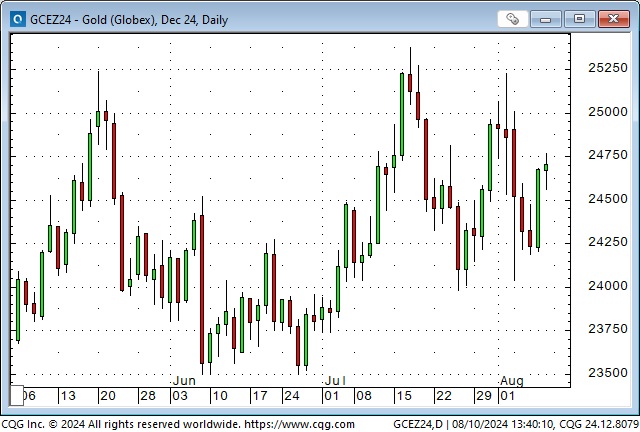
Gold spiked lower on Monday, dropping ~$120 from Friday’s highs, but rebounded to close the week slightly below last Friday’s close.
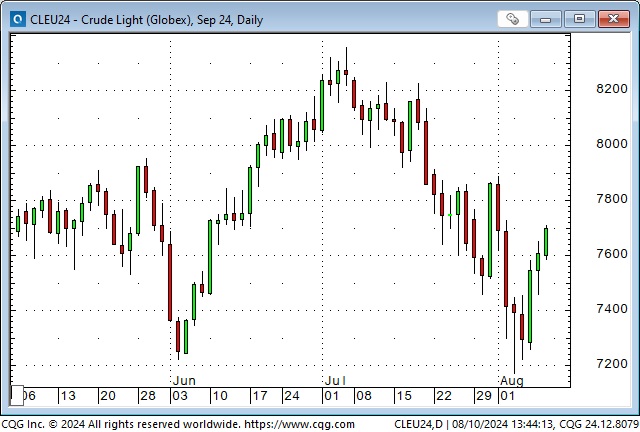
WTI fell to 7-month lows on Monday, down ~$11 from July’s highs, but rebounded to close ~$3 higher on the week.
Positioning
In early July, investors and traders were aggressively long stocks and short Yen. S&P option VOL was complacent, near the lows of the last five years. Market sentiment was definitely “risk on,” with the leading stock indices hitting record highs and the Yen hitting record lows. Markets were vulnerable to a correction. July 11 was the Key Turn Date when softer-than-expected CPI lifted the NAZ and the Nikkei to new record highs, but they reversed lower and closed down on the day as the Yen soared on intervention by the Japanese authorities.
Triggers
1) US stock market strength was predicated on Big Cap Tech, and the “love affair” with AI was starting to wane (momentum trades were too big.) 2) The Yen carry trade, “The Greatest Carry Trade Of All-Time” started to unwind. 3) The US and global economies were showing signs of slowing. 4) Markets were beginning to worry that the Fed would stay too high for too long. 5) Margin call selling added to selling pressure. 5) Geopolitical tensions. 6) It’s August, and liquidity is thin.
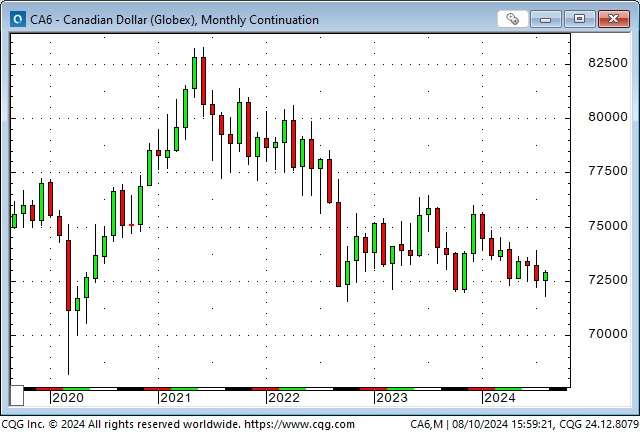
The Canadian Dollar – an example of using the Commitments of Traders (COT) data
The CAD has trended lower since December, falling from ~76 cents to ~72 cents. On Monday, when markets were “stressed out,” it fell to a 2-year low and was only a few ticks away from reaching a 4-year low. Like many other markets that tumbled on Monday, the CAD rallied from those lows to close higher on the week.
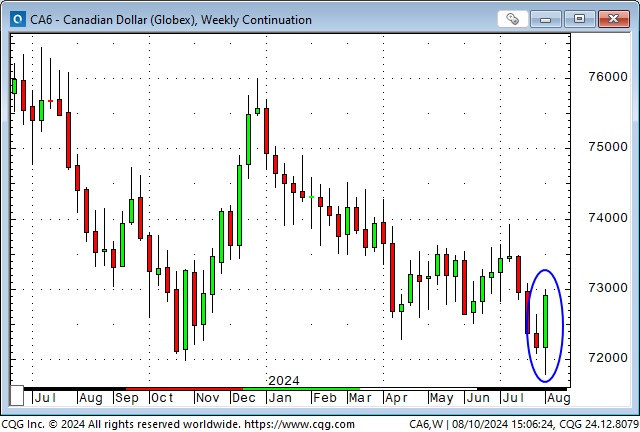
Since March, speculators have been building a net short position in CAD futures, which reached a (massive) record size (~205,000 contracts) in late July as the CAD fell from ~74 cents to ~72 cents. Open interest in CAD futures increased from ~192,000 on April 1 to a record high (X delivery spikes) of ~326,000 on August 1, a 70% increase. My rough estimate of the average price of these net short positions is ~73 cents.
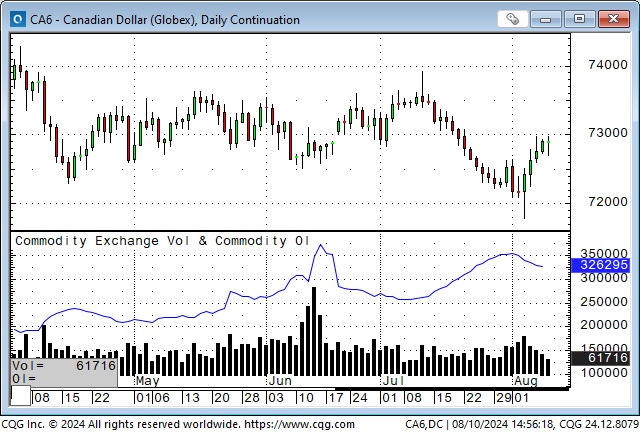
The COT data as of August 6 showed a week-over-week reduction in the net speculative position of ~15,000 (~7%) contracts (speculators covered some short positions), and open interest has declined ~8% from the August 1 highs.
The Weekly Key Reversal Up on the charts (blue ellipse in the weekly chart) may encourage speculators to continue covering short positions. The Friday rally in the CAD, after dipping on weaker-than-expected employment data, may also encourage short covering (the CAD ended the day higher despite receiving “bad” news.)
The “set-up” in current CAD positioning may be similar to the “set-up” in the Yen and the Swiss Franc earlier this year, where speculators built up massive short positions in a declining market only to cover as prices reversed higher. The time horizons of the swings from building shorts to covering shorts in the Yen and the Swiss was several months.
It is also possible that the short positioning will pay off “big time” for the speculators if the CAD breaks below the lows of the past two years and challenges the lows of around 68 cents made during the panic of March 2022.
I have been interested in using the COT data to “get a feel” for how traders are positioned since Steve Briese explained it to me over 30 years ago. Still, I had two problems: 1) It seemed to require a longer trading time horizon than I was used to, and 2) I couldn’t find an easy-to-use and timely display of the data until I found Crowded Market Reports by Jason Shapiro. I highly recommend Jason’s service, not only for how well the data is displayed but also for his explanations of how to use it. Jason is also featured in dozens of YouTube videos.
Thoughts on trading
The “August panic” may be over, but the scare will likely make traders more cautious (stocks don’t always go up!) Then again, the swing from “risk on” to “risk off” that happened over the past four weeks may only be the first leg down of a much more significant decline. I’m open-minded to both possibilities.
If I could only trade one asset class, I’d trade currencies. I was the currency analyst at Conti in 1983-84 (Conti was probably the world’s largest commodity brokerage firm at the time), and (for my own account) I’ve traded currencies more than anything else. After all those years, my #1 observation about currencies is that trending currencies go WAY further than you can imagine, and then they turn on a dime and go the other way, leaving charts with “V” shaped tops and bottoms. The fact that they turn on a dime and go the other way is “proof” that they went too far before turning.
This week’s VOL explosion was incredible, but people who don’t trade options may underestimate its dramatic impact. The old warning against shorting options is, “You make a little money 19 trades out of 20, and on the 20th trade, you lose everything.” That may or may not be accurate, but it illustrates the concept of “convexity.” When you’re naked short an option, you have limited upside (you collect, at most, the premium), but you have unlimited risk. If you’re long an option, you have limited risk (the premium you paid) and unlimited profit potential.
However, an option seller’s risks are not limited to an adverse price change in the underlying, which becomes increasingly painful as the delta (the rate of change) increases. An increase in VOL is also a risk. Here’s an example.
I bought gold puts last week as a limited-risk bet that gold prices would fall. Gold rallied, and the puts declined in price. However, owning puts gave me a bigger “time window” to hold the position if the market moved against me. I liked how the market fell on Friday after failing to make new highs, so I stayed with the trade even though it was “underwater.”
On Monday, gold fell below where it had been when I bought the puts, so I was back to breakeven (or better) regarding the gold price. However, the jump in VOL from ~14% when I bought the options to ~20% meant that the options had more than doubled in value. It was an unanticipated gain, and as I watched VOL across markets start to fall back from the “explosion” highs, I covered my gold puts.
My short-term trading
I started this week with only the long gold puts and took profits on Monday.
This week, I traded the S&P from both the long and short sides. I caught a good piece of the Thursday breakdown, which gave me net S&P gains for the week.
I traded the CAD from the long side this week, broke even on closed trades and went into the weekend with a long position.
On my radar
The CPI report on Wednesday could rock the markets.
I plan to go to Vancouver next week for a few days to play golf with my son and see some old friends. I will probably not trade much.
I will be back home and playing golf in the club championship next weekend, so there may be no Trading Desk Notes next weekend.
The Barney report
The fantastic summer weather continues, so Barney and I have been doing most of our walks on the cooler forest trails. This is not good weather for wearing a fur coat!

Listen to Victor talk about markets
This morning, on the Moneytalks show with Mike Campbell, we discussed this week’s wild volatility across markets and the massive net short speculative position in the CAD. You can listen to the entire show here. Mike’s feature guest, Rick Rule, is an old friend and a very savvy market guy. My spot with Mike starts around the 48-minute mark.

I did my monthly 30-minute interview with Jim Goddard this morning on the This Week In Money Show. We discussed my Big-Picture views of what’s happening across markets and drilled down on the Yen, CAD, gold, copper, and uranium and what I mean by “mean reversion” and “key turn dates.” We wrapped up the interview with my thoughts on risk management and why “capital preservation” is SO important. You can listen here. Ross Clark is an old friend and an excellent technical analyst, and I’ve known Marty Armstrong for over 40 years – he’s had many brilliant forecasts!

Heads up Guys
Regular readers know I post links to Headsupguys because I’ve had too many friends who took their own lives. So many times when that happens, people say, “I would have done something if I’d known he was struggling.”
If you, or someone you know, is down or depressed, reach out to these guys. They can help.

The Archive
Readers can access weekly Trading Desk Notes from the past seven years by clicking the Good Old Stuff-Archive button on the right side of this page.
Subscribe: You have free access to everything on this site. Subscribers receive an email alert when I post something new, usually four to six times a month.
Victor Adair retired from the Canadian brokerage business in 2020 after 44 years and is no longer licensed to provide investment advice. Nothing on this website is investment advice for anyone about anything.
STAY INFORMED! Receive our Weekly Recap of thought provoking articles, podcasts, and radio delivered to your inbox for FREE! Sign up here for the HoweStreet.com Weekly Recap.
Victor Adair August 10th, 2024
Posted In: Victor Adair Blog