ALWAYS CONSULT YOUR INVESTMENT PROFESSIONAL BEFORE MAKING ANY INVESTMENT DECISION

July 27, 2024 | Trading Desk Notes for July 27, 2024

Victor Adair


Reversion to the mean continues across key markets
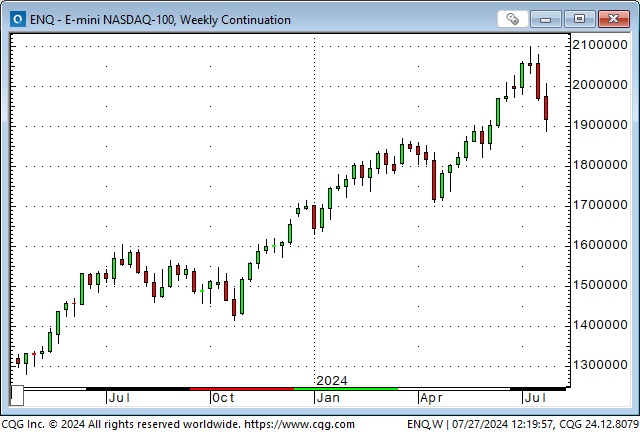
Big-cap tech stocks fuelled a ~50% rally in the NAZ (~39% in the S&P) from October to July; their recent weakness contributed to the NAZ falling ~10% (S&P ~5%) from record highs.
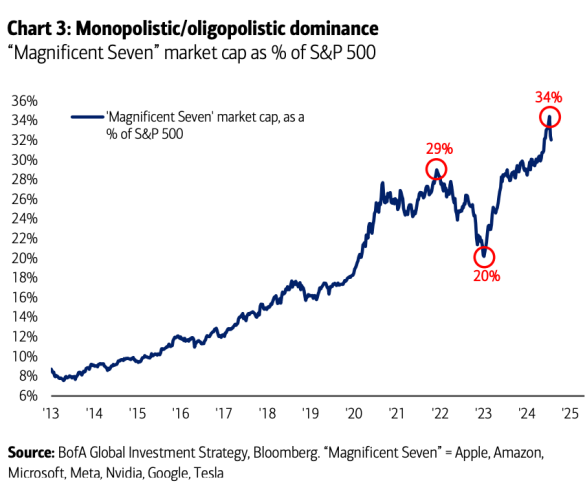
The MAG7 market cap is down ~$2 trillion (~12%) since July 10.
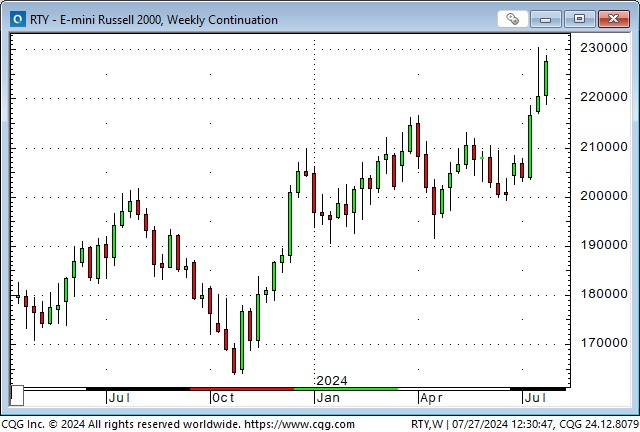
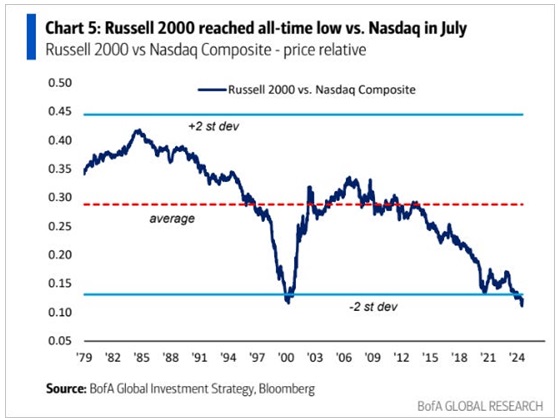
The Russell 2000 index of small-cap stocks rallied ~12% over the last three weeks as big-cap tech stocks fell, as capital “rotated” between the market sectors.
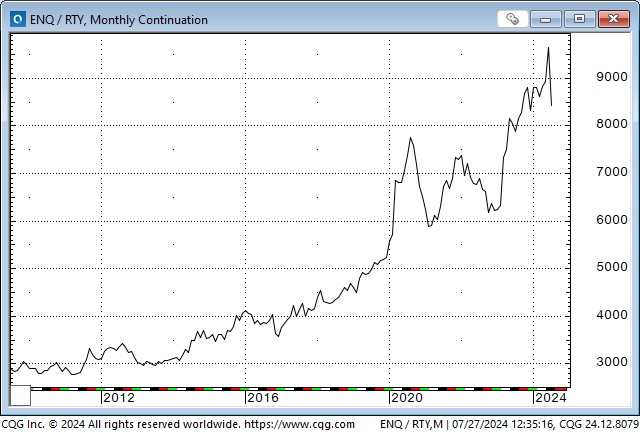
Since the GFC of 2008-09, the NAZ has more than tripled against the RUS; the recent ~17% correction in the spread is relatively modest.
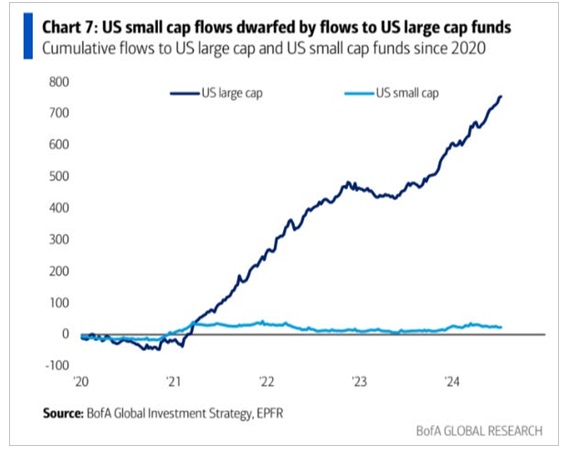
Capital flows over the last four years have hugely favoured large-cap stocks. Passive investing has accelerated that trend.
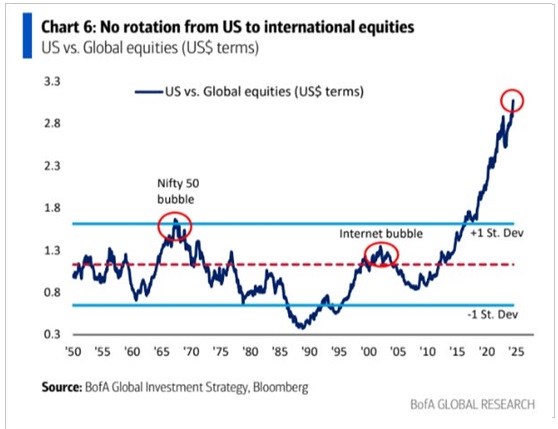
International capital flows have hugely favoured American equities (capital comes to America for safety and opportunity) over all other nations, with most of those funds going into big-cap stocks.
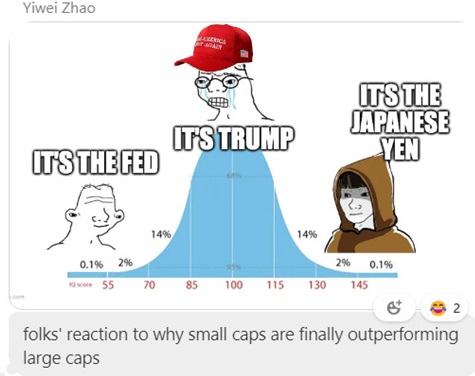
There have been a variety of opinions as to why small-cap stocks have outperformed large-cap stocks (I like reversion to the mean driven by positioning risk), as this cartoon from the Macrotourist illustrates.
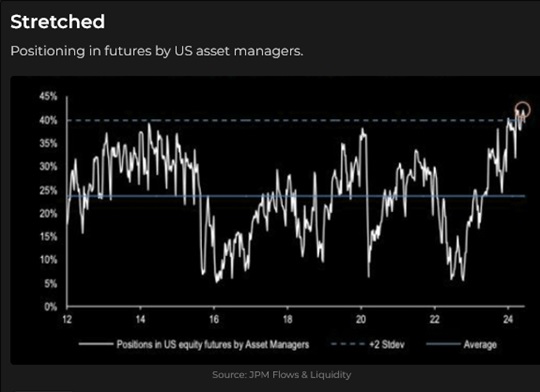
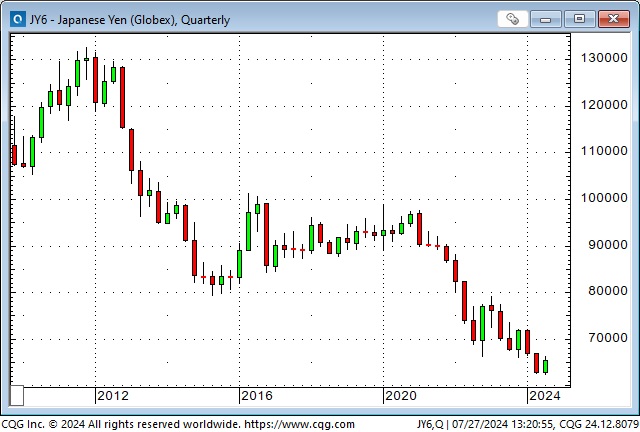
The Japanese Yen has rallied ~6% from 34-year lows reached on July 11. The initial leg of the rally was sparked by the second round of intervention by Japanese authorities (the first round was in April). Their second intervention was much more successful than the first, partly because they hit the market as the USD was on the “backfoot” following the softer-than-expected CPI data.
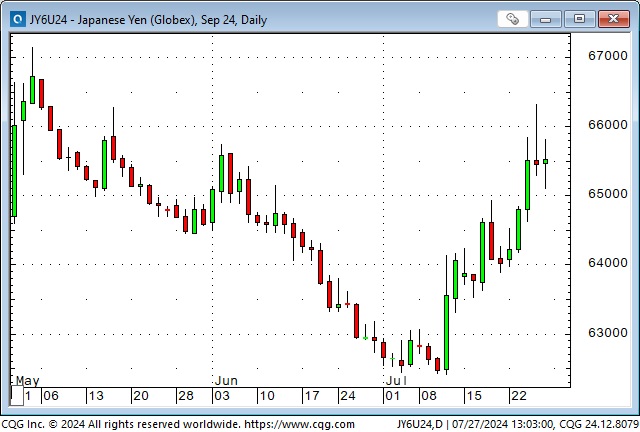
The Yen has continued to rally since the second intervention, likely benefiting from the partial (there is much more to come) unwinding of massive speculative short Yen positions against the USD and other currencies. (The Japanese authorities wanted their intervention to ignite this short-covering.) This positioning is called the “carry trade,” which seeks to benefit from interest rate differentials between currencies.
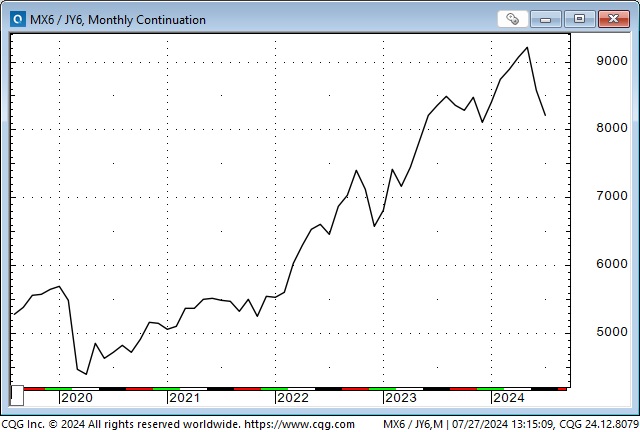
The Japanese Yen / Mexican Peso was a classic carry trade, with Yen short rates around zero in the past few years, while Mexican short rates were around 11%. I’ve written about this spread several times this year, noting that not only did hedge funds benefit from the ~11% interest rate spread, but the Peso doubled against the Yen over the last four years, and, of course, the hedgies would have done this trade with substantial leverage.
A key turn date?
I wrote about a possible key turn date in risk assets in last week’s notes. A KTD is when several markets reverse course on or around the same date. It signals a (profound) change in market sentiment/psychology/positioning.
I noted that the S&P had a classic weekly key reversal down from record highs, that several other benchmark stock indices turned lower, that the Yen had turned dramatically higher (from record lows) against most other currencies, and that gold had reversed lower from record highs. Those moves were all sustained and extended this week – strengthening the case that there was a key turn date.
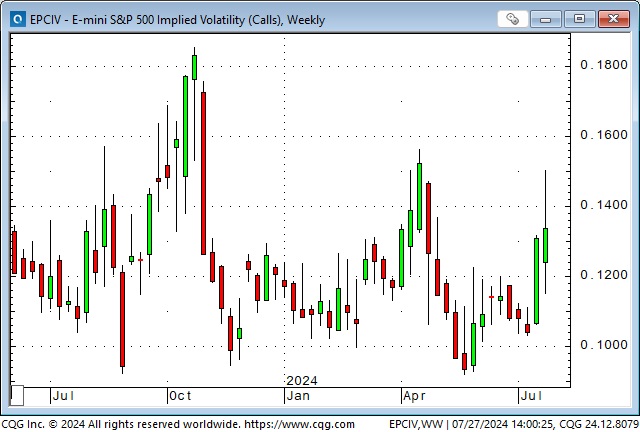
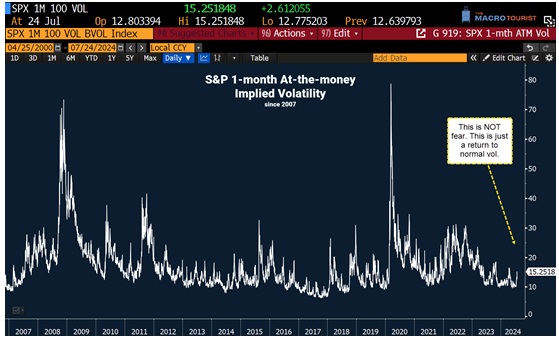
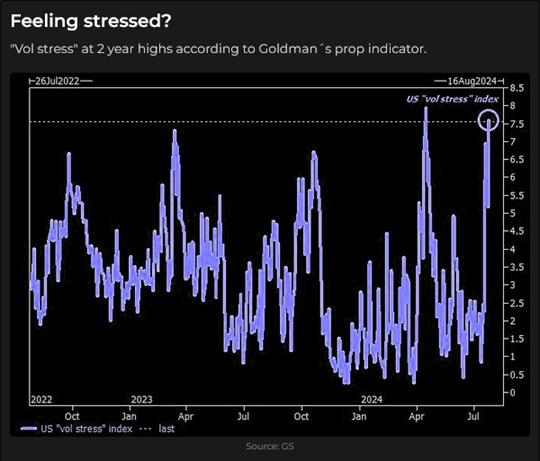
The sharp rise in VOL from historically low, complacent levels was another confirmation of a key turn date.
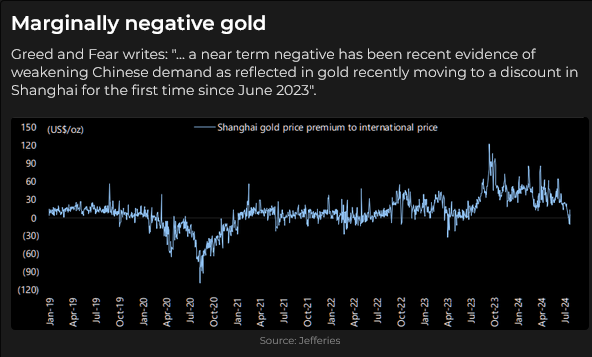
Gold
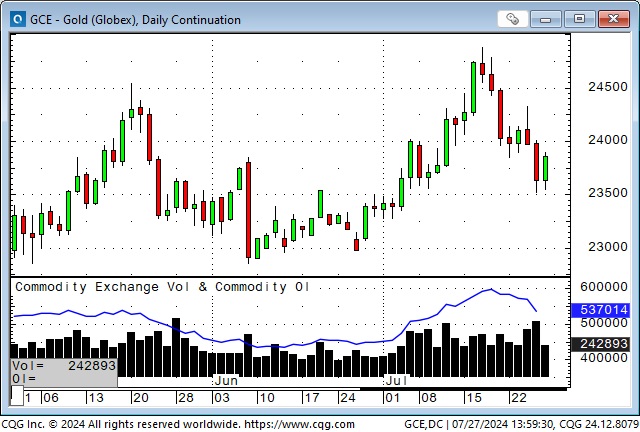
Gold rallied ~$50 on the July 11 CPI report and another ~$50 over the subsequent four trading sessions, to reach new all-time highs, eclipsing the previous May 20 record highs. But then the rally reversed, and gold fell ~$140 to this week’s lows. Open interest rose ~30% from late June to a 3-year high on the July 17 record high, then fell ~13% as prices declined to this week’s lows.
In previous Notes, I’ve written that speculative buying of gold in the Shanghai futures market defined the high in May. I believe there are many good reasons for Chinese citizens to buy gold, and at times of strong demand, the Chinese price can be substantially above international prices. However, this chart (from the one-and-only Chris Wood) shows that Chinese gold prices now trade at a discount to global prices, perhaps indicating a drop in Chinese demand.
I recommend that readers who would benefit from an in-depth analysis of the gold market sign up for a trial subscription to Martin Murenbeeld’s weekly Gold Monitor.
Copper
Copper prices soared over 40% from February lows to May’s all-time highs as speculators aggressively bought into the “electrification of everything” narrative, essentially the story of unlimited copper demand in a world of severely limited supply. Open interest increased by ~50% between February and May, and spec net long positioning rose to 3-year highs.
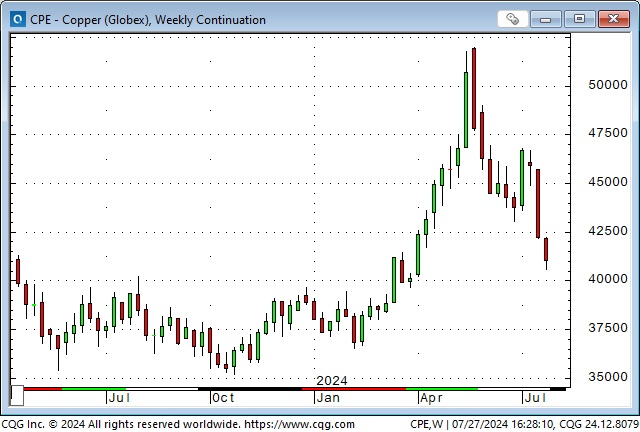
Copper prices have declined ~20% from the highs, and the net long speculative positioning has declined ~38%, but it is still substantially long relative to the average of the past few years.
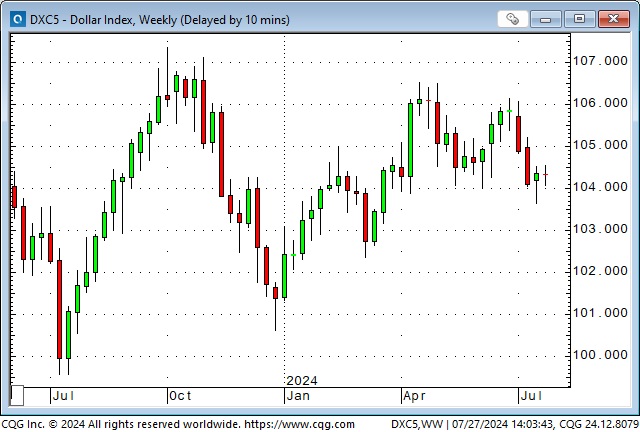
Currencies
The US Dollar Index reversed higher from 4-month lows last week.
The Canadian dollar briefly spiked to a 3-month high on the July 11 CPI data but then reversed and fell to 4-month lows (falling for 11 of the last 12 trading sessions). As expected, the BoC cut short rates by 25 bps this week. Another 25 bps cut is expected in September. The 2-year interest rate differential between Canada and the USA is ~80 bps premium the USA.
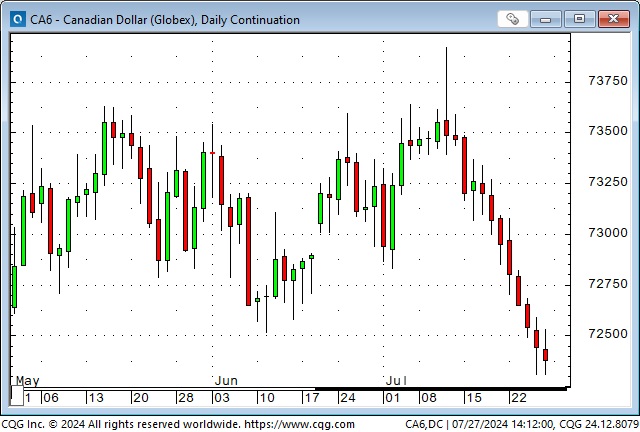
Open interest in the CAD is at record highs (outside of delivery spikes) and is more than double the average of the past few years. It has increased ~30% in the last 12 trading sessions as shorts have added to their positions.
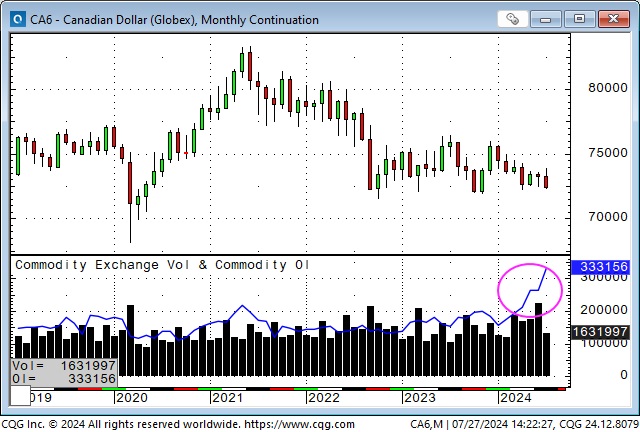
COT data shows that net short speculative positioning (as of July 23) is at record highs (Specs are massively short the CAD). The CAD is ~80 ticks away from making 4-year lows.
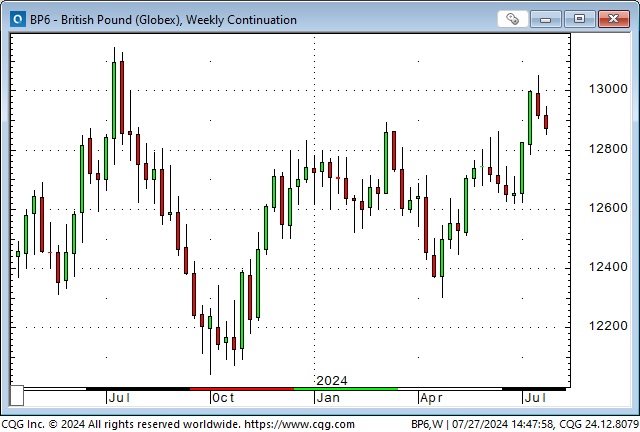
The British Pound rallied to 12-month highs following the national election on July 4 but has turned lower over the past two weeks. Speculative accounts have ramped up their net long positioning on the Pound over the past three weeks to record highs. (Specs are massively long the Pound.)
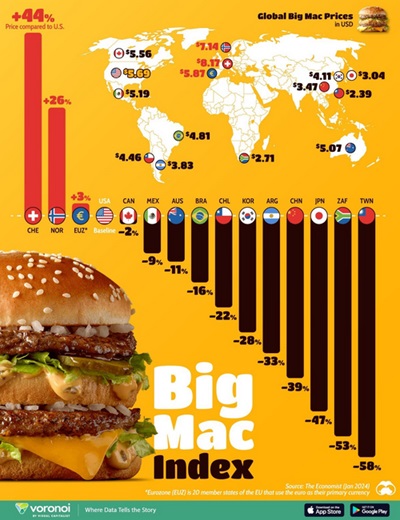
The Big Mac Index shows the cost of a Big Mac (in USD equivalents) in different countries and is a “quick and dirty” gauge of overvalued/undervalued currencies relative to the USD. This photo shows the Swiss Franc is 44% overvalued, and the Taiwan Dollar is 58% undervalued. This fits with Trump’s view (and many other people’s views, including mine) that Asian currencies are substantially undervalued by their governments to support their exports.
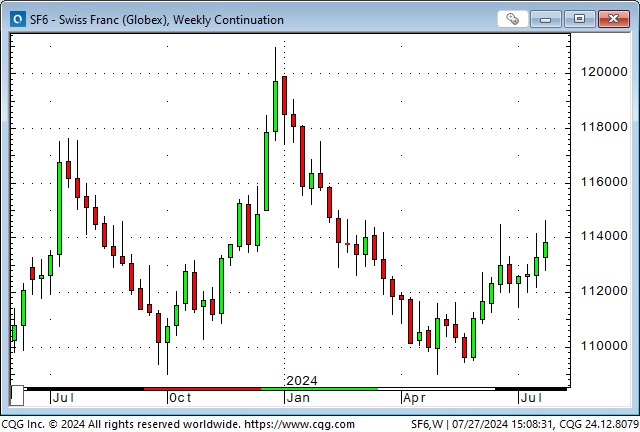
The Big Mac index may also explain (to some degree) why speculative accounts have maintained a substantial net short position against the Swiss Franc since it began falling against the USD (and other currencies) in January. Open interest has more than doubled YTD (as specs have ramped up their short positioning) from its average of the past four years. The Swiss 2-year yield is ~0.69% against ~4.38% in the USA.
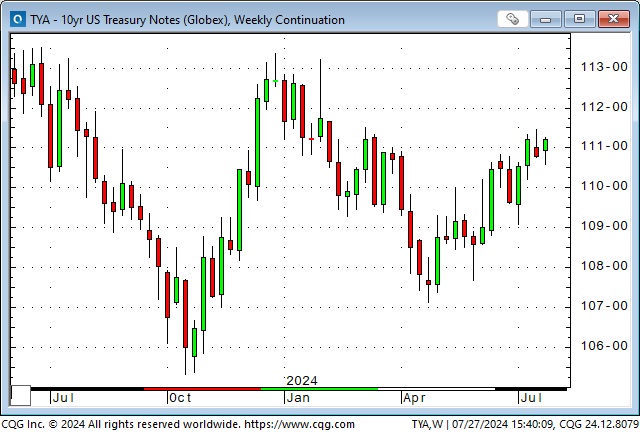
Interest rates
Bond prices have trended higher (yields lower) since April, and with short rates unchanged, the yield curve has become less inverted.
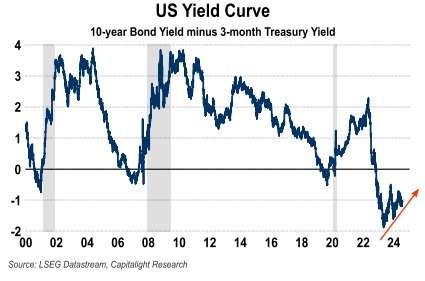
The yield curve chart is courtesy of my friend and renowned gold analyst, Dr. Martin Murenbeeld.
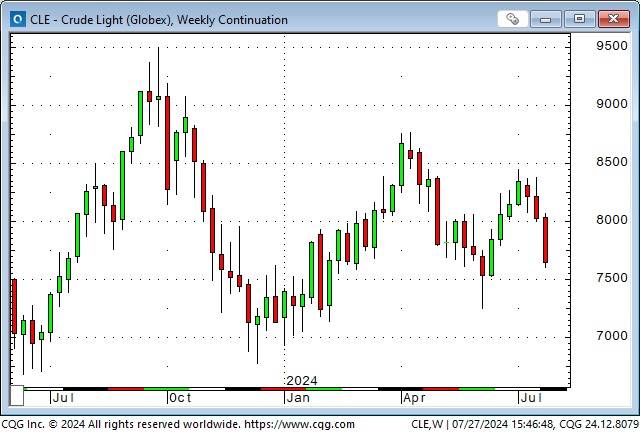
Energy
WTI closed this week at a 6-week low, down ~10% from the 3-month highs reached at the beginning of July.
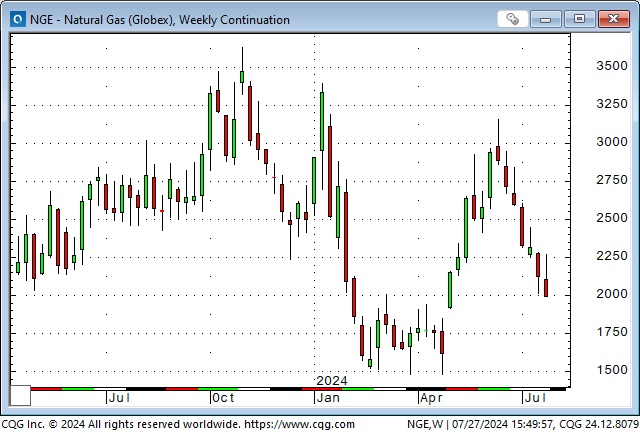
Nat gas has closed lower for 6 of the last 7 weeks (down ~36%).
I highly recommend Josef Schachter’s Energy Report for readers interested in good commentary on the crude and natural gas markets. His weekly Eye On Energy report is free, and his monthly analysis of publicly traded energy stocks is modestly priced, given the quality of his work. I have attended all of his annual conferences in Calgary and have been amazed at the quality of the companies presenting there.
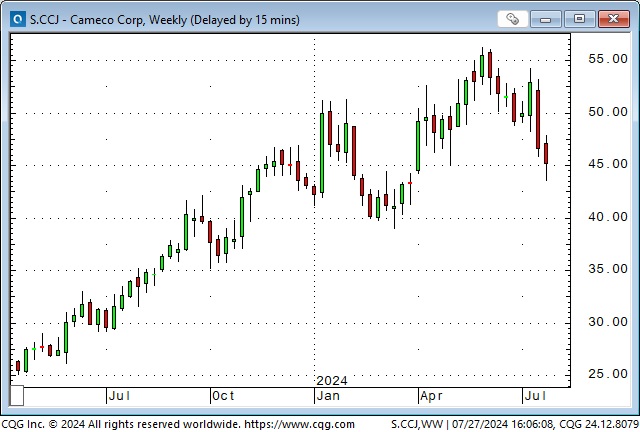
Uranium plays have had a fantastic rally over the past four years but have fallen back the past two months.
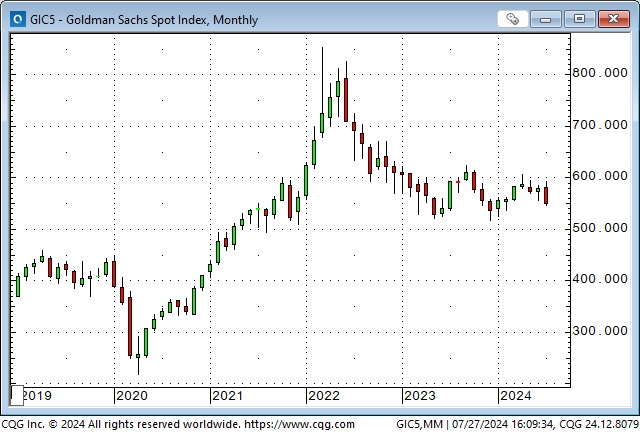
The energy-heavy Goldman Sachs commodity index hit a 14-year high on the invasion of Ukraine (energy and grain prices soared) but has trended lower since then.
My short-term trading
I started this week short the S&P, gold, and the British Pound and long the CAD. I liquidated all of those trades on Monday at a profit. I bought the S&P a couple of times on Friday, looking for a bounce after the hard sell-off, but was stopped for modest losses. I was flat going into the weekend.
Thoughts on trading
You can’t avoid “leaving money on the table.” I covered my short S&P on Monday for a decent gain. I expected a bounce and planned to get short again if the bounce didn’t have legs. The market rallied some on Monday and some more on Tuesday but then collapsed overnight and kept falling on Wednesday without me. I didn’t see a good entry point to get short, so I sat on the sidelines (mumbling to myself.)
On Monday, I covered my short gold for a gain of $70 per ounce, expecting a bounce. The market bounced ~$30, and I was happy to have taken my profits when I did. I waited to get short again. I didn’t see a good entry point, and the market fell ~$80 without me. (more mumbling.)
Those two events provoke the question, “Am I trading to make money or to prove that I’m right about market direction?”
I caught part of a move and missed another. I came out money ahead. I managed my risks, and yes, I left “money on the table,” but that happens all the time. What’s done is done. Move on.
On my radar
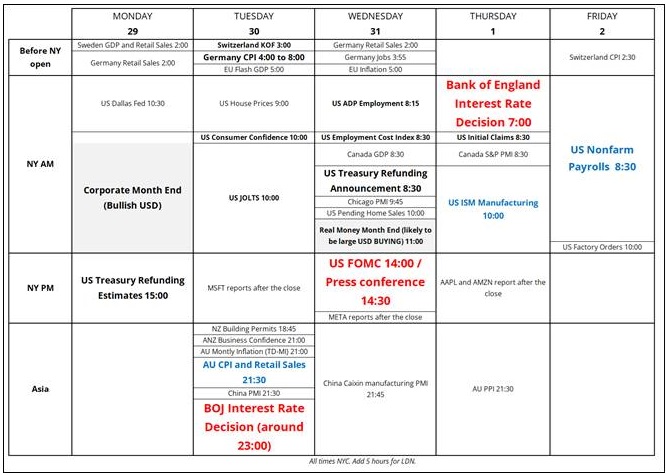
The scheduled events for next week are a big deal, and there will probably be an unscheduled event or two that will rock the boat. Expect volatility.
Next week is BIG for corporate reports, including AMZN, AAPL, META and MSFT. Companies representing ~40% of the S&P market cap report next week.
Here’s next week’s calendar from Brent Donnelly.
The Barney report
Here’s the Barns patiently waiting for me to finish writing my TD Notes. He is such a good boy!

Heads up Guys
Regular readers know I keep posting links to Headsupguys because I’ve had too many friends who took their own lives. So many times when that happens, people say, “I would have done something if I’d known he was struggling.”
If you, or someone you know, is down or depressed, reach out to these guys. They can help.

The Archive
Readers can access weekly Trading Desk Notes from the past seven years by clicking the Good Old Stuff-Archive button on the right side of this page.
Subscribe: You have free access to everything on this site. Subscribers receive an email alert when I post something new, usually four to six times a month.
Victor Adair retired from the Canadian brokerage business in 2020 after 44 years and is no longer licensed to provide investment advice. Nothing on this website is investment advice for anyone about anything.
STAY INFORMED! Receive our Weekly Recap of thought provoking articles, podcasts, and radio delivered to your inbox for FREE! Sign up here for the HoweStreet.com Weekly Recap.
Victor Adair July 27th, 2024
Posted In: Victor Adair Blog