ALWAYS CONSULT YOUR INVESTMENT PROFESSIONAL BEFORE MAKING ANY INVESTMENT DECISION

July 12, 2024 | The Most Splendid Housing Bubbles in Canada, June: A Rate Cut, and? Overall Prices Don’t Move, -14% from Peak, -3.4% YoY. Sales -9.4% YoY

Wolf Richter


The Bank of Canada cut its rates at the beginning of June, and not much happened in the Canadian housing market. Home sales rose by 3.7% in June from the beaten-down levels in May, seasonally adjusted. But year-over-year, home sales were down 9.4%, a sharper year-over-year decline than in May (-5.9%). New listings rose by 1.5% in June from May, the fifth month of increases over the past six months. Inventory listed for sale was up by 26% year-over-year. Supply ticked down to 4.2 months in June – same as in April, but a tad lower than in May – and up from 3.2 months in June last year.
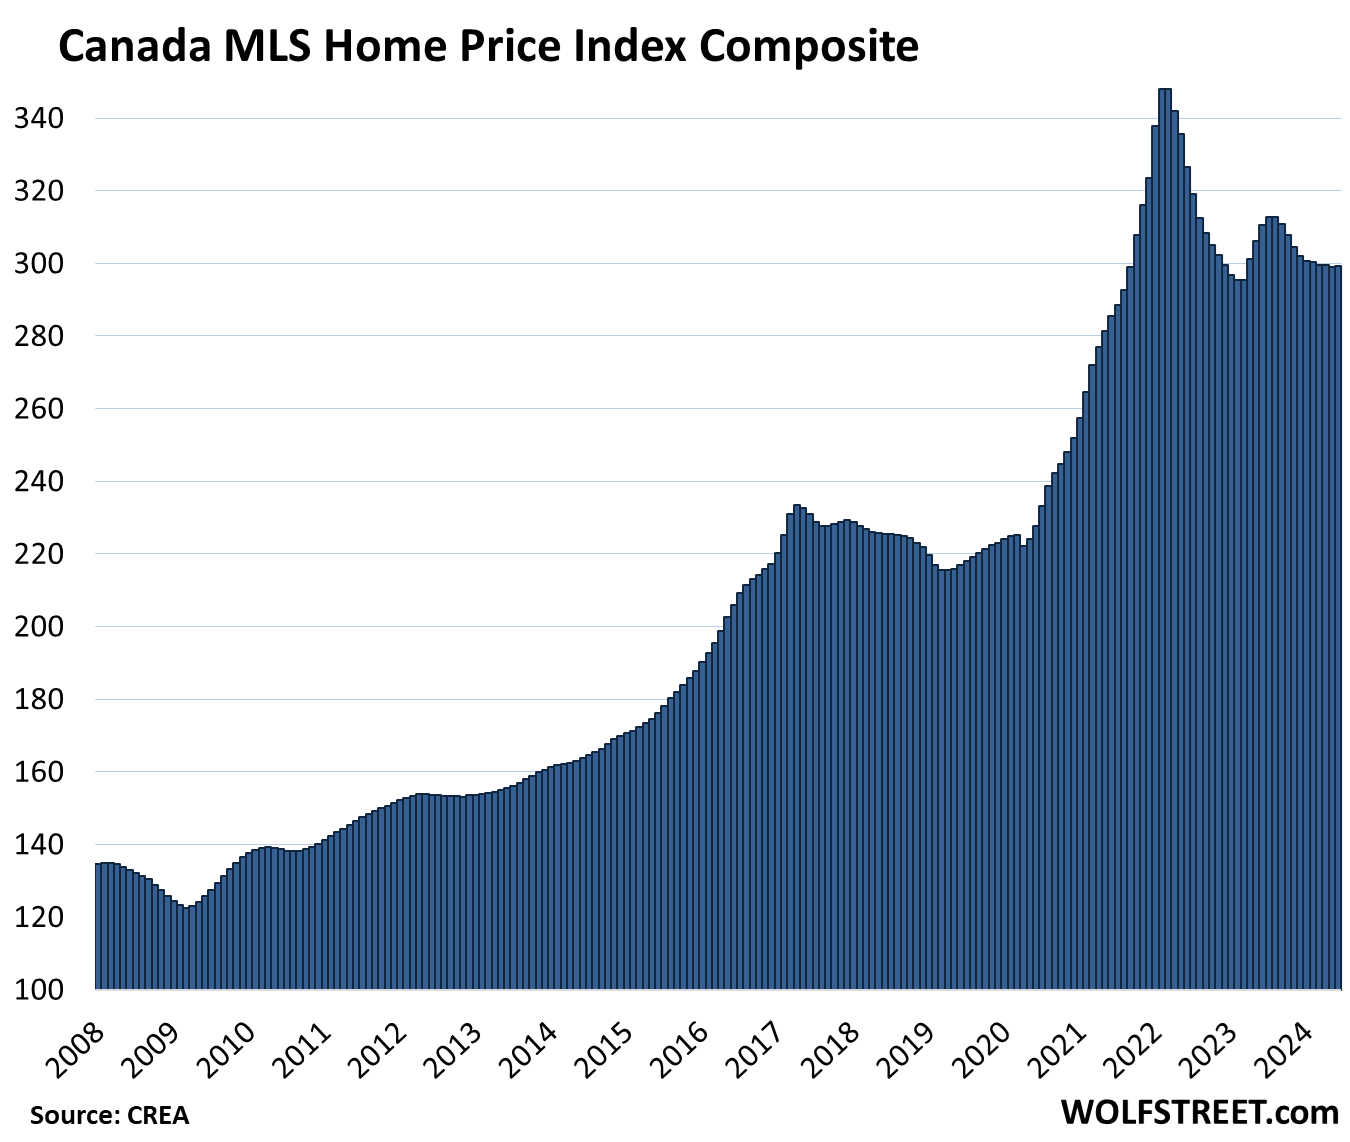
Home prices edged up 0.1% in June from May, seasonally adjusted, but essentially have been flat all year, with just minuscule up-and-down squiggles like this, after having declined in the second half of 2023, according to the Composite MLS Home Price Index by the Canadian Real Estate Association (CREA) today. Single-family prices ticked up, and condo prices fell further.
From the peak in February 2022, the index has dropped 14%, and is back where it had first been in September 2021. Year-over-year, the Composite MLS Home Price Index fell 3.4%, the third year-over-year decline in a row, with prices rising to all-time highs in some markets and falling further in others.
Home Prices in the most splendid Housing-Bubble Markets.
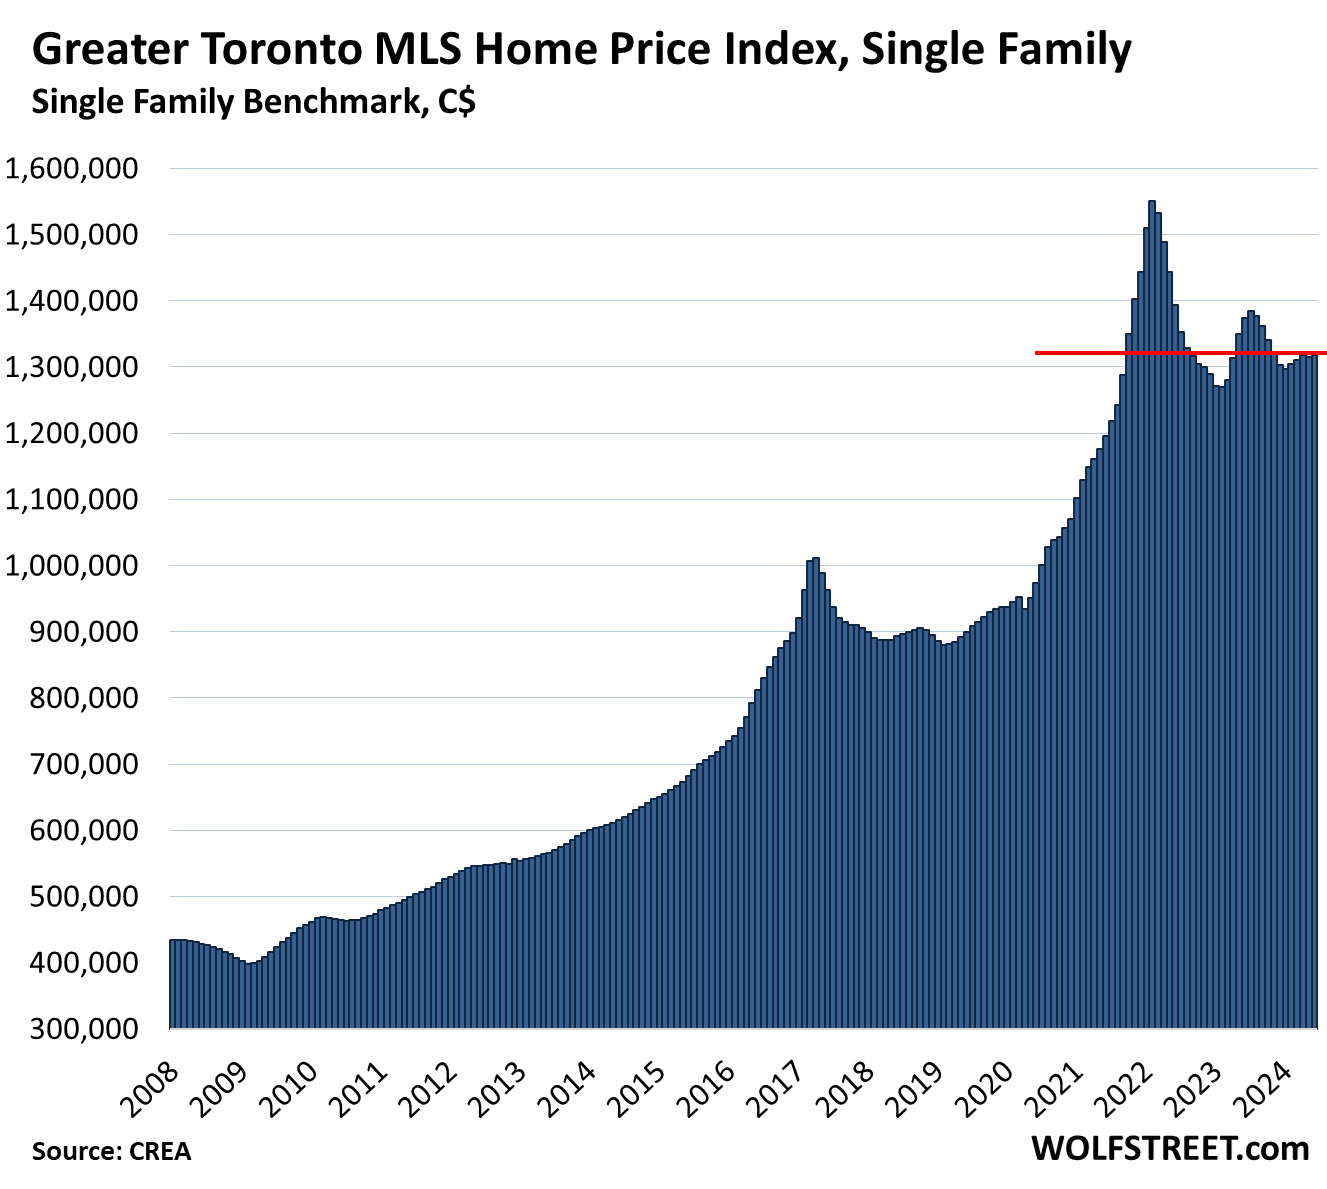
Greater Toronto Area, single-family MLS Home Price Benchmark Index (all prices in Canadian dollars):
- Month-to-month: +0.3% to $1,318,600; below October 2021
- From peak in February 2022: -15%
- Year-over-year: -4.0%, second month of year-over-year declines in a row (-2.6% in May).
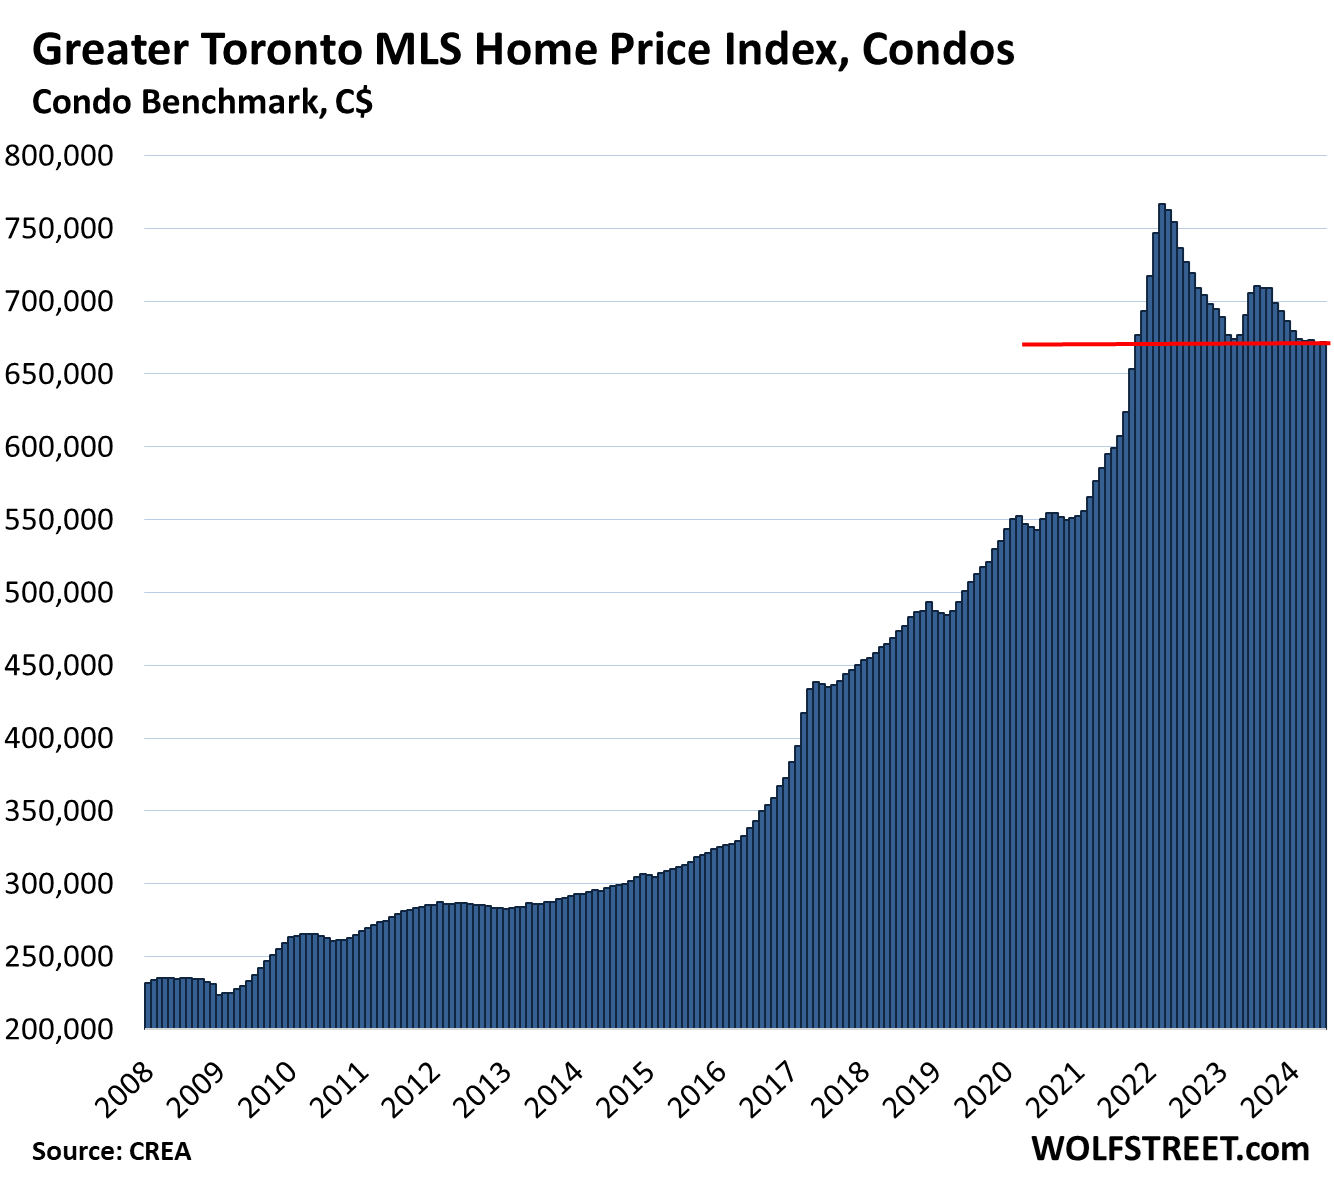
Greater Toronto Area, condo benchmark price:
- Month-to-month: +0.2% to $671,900 where it had been in November 2021
- From peak in February 2022: -12.4%
- Year-over-year: -4.8%
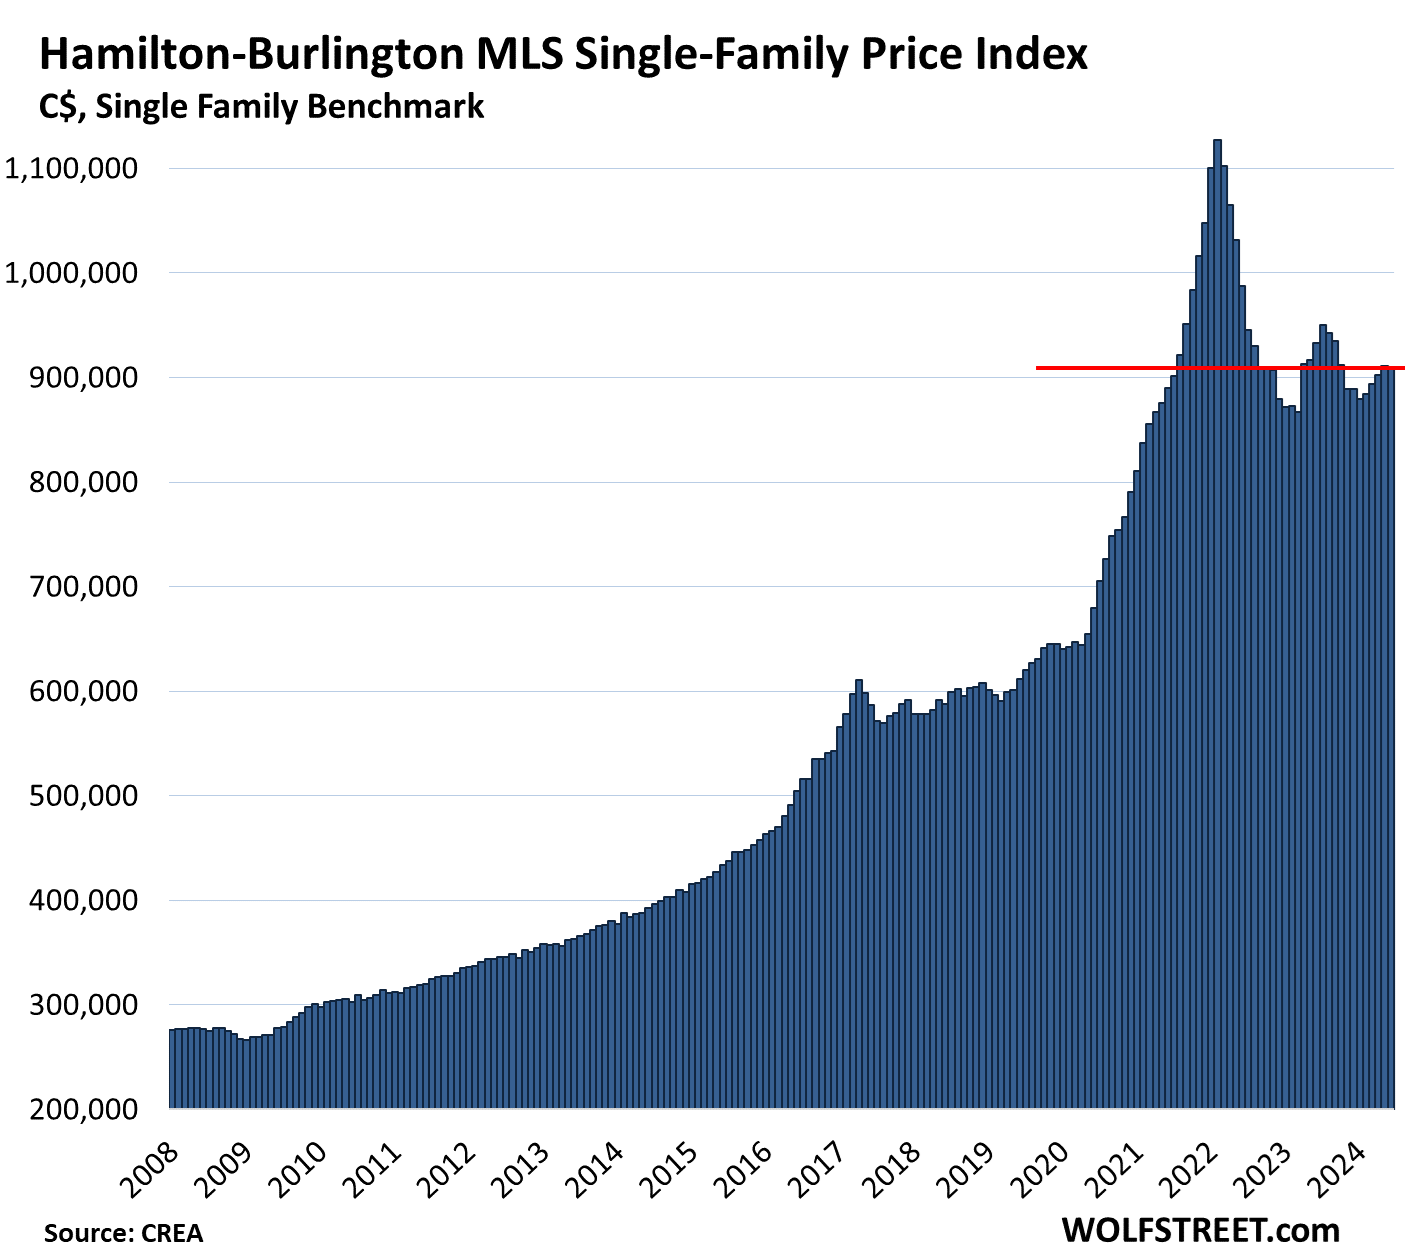
Hamilton-Burlington metro single family benchmark price (in the “Greater Toronto and Hamilton Area”):
- Month-to-month: -0.2% to $908,900, where it had been in August 2021
- From peak in February 2022: -19.4%
- Year-over-year: -2.6%, third month in a row of declines.
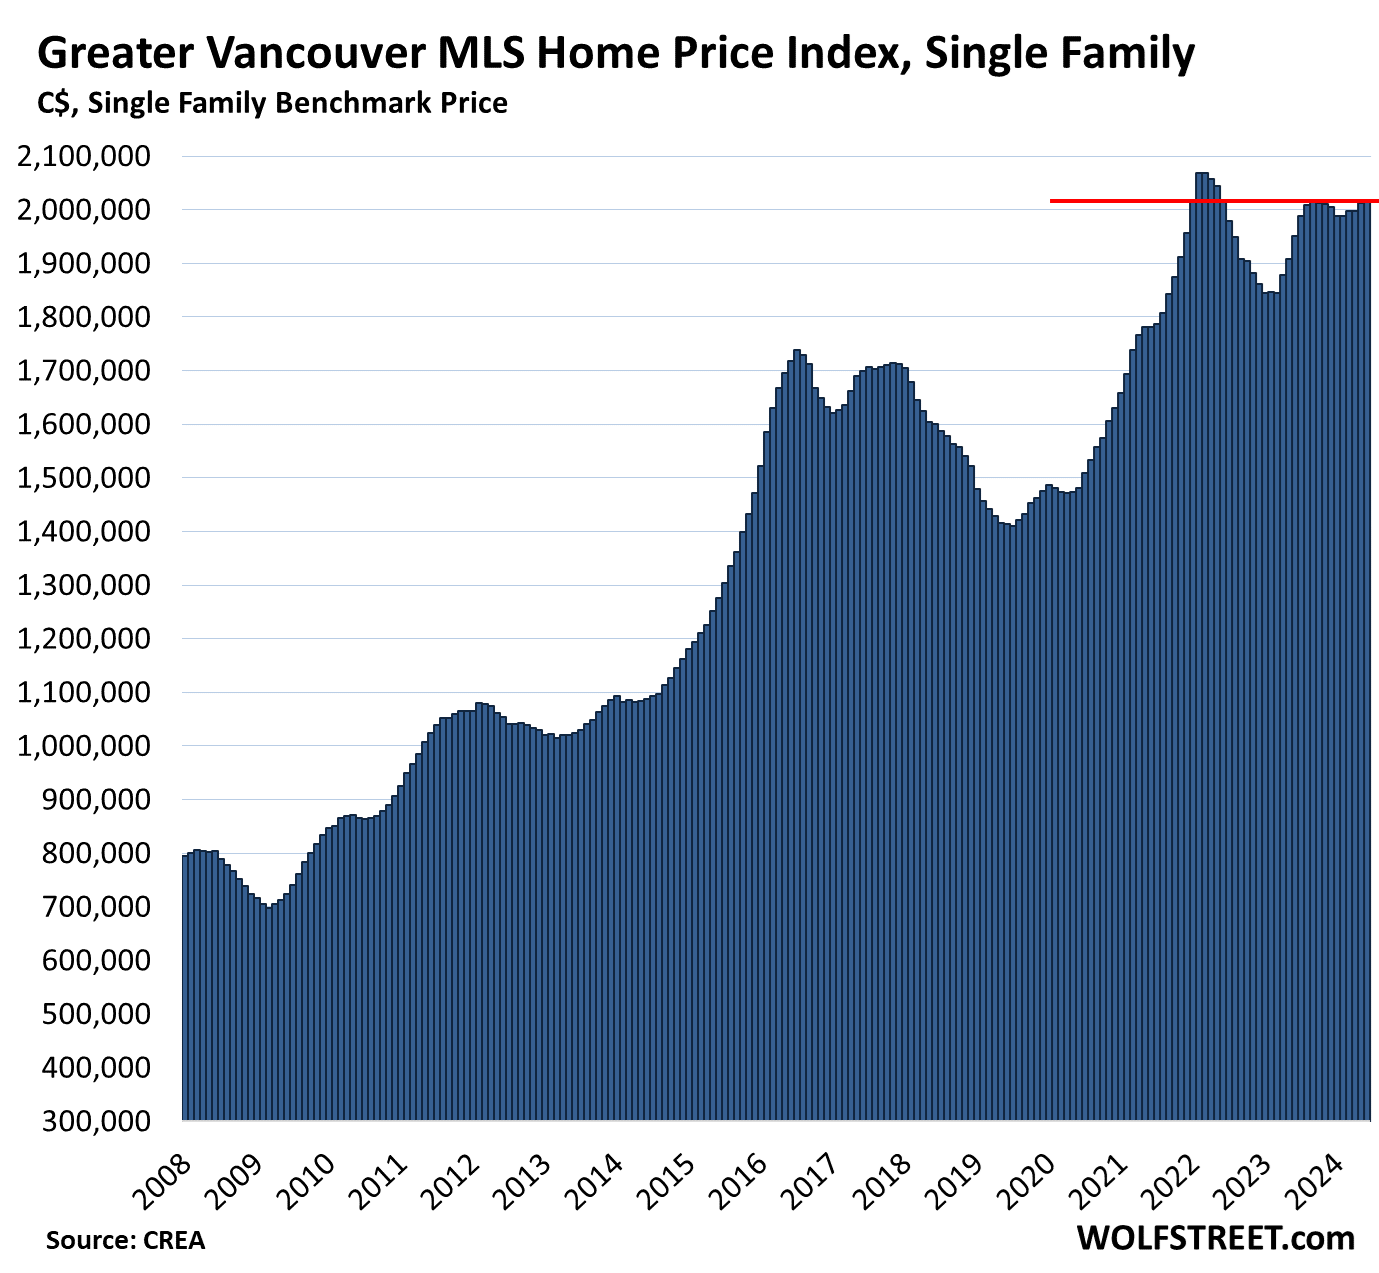
Greater Vancouver single-family benchmark price:
- Month-to-month: +0.2% to $2,017,100, where it had been in January 2022, roughly flat since September.
- From peak in April 2022: -2.5% or -$42,200
- Year-over-year: +3.4%, smallest gain since August 2023.
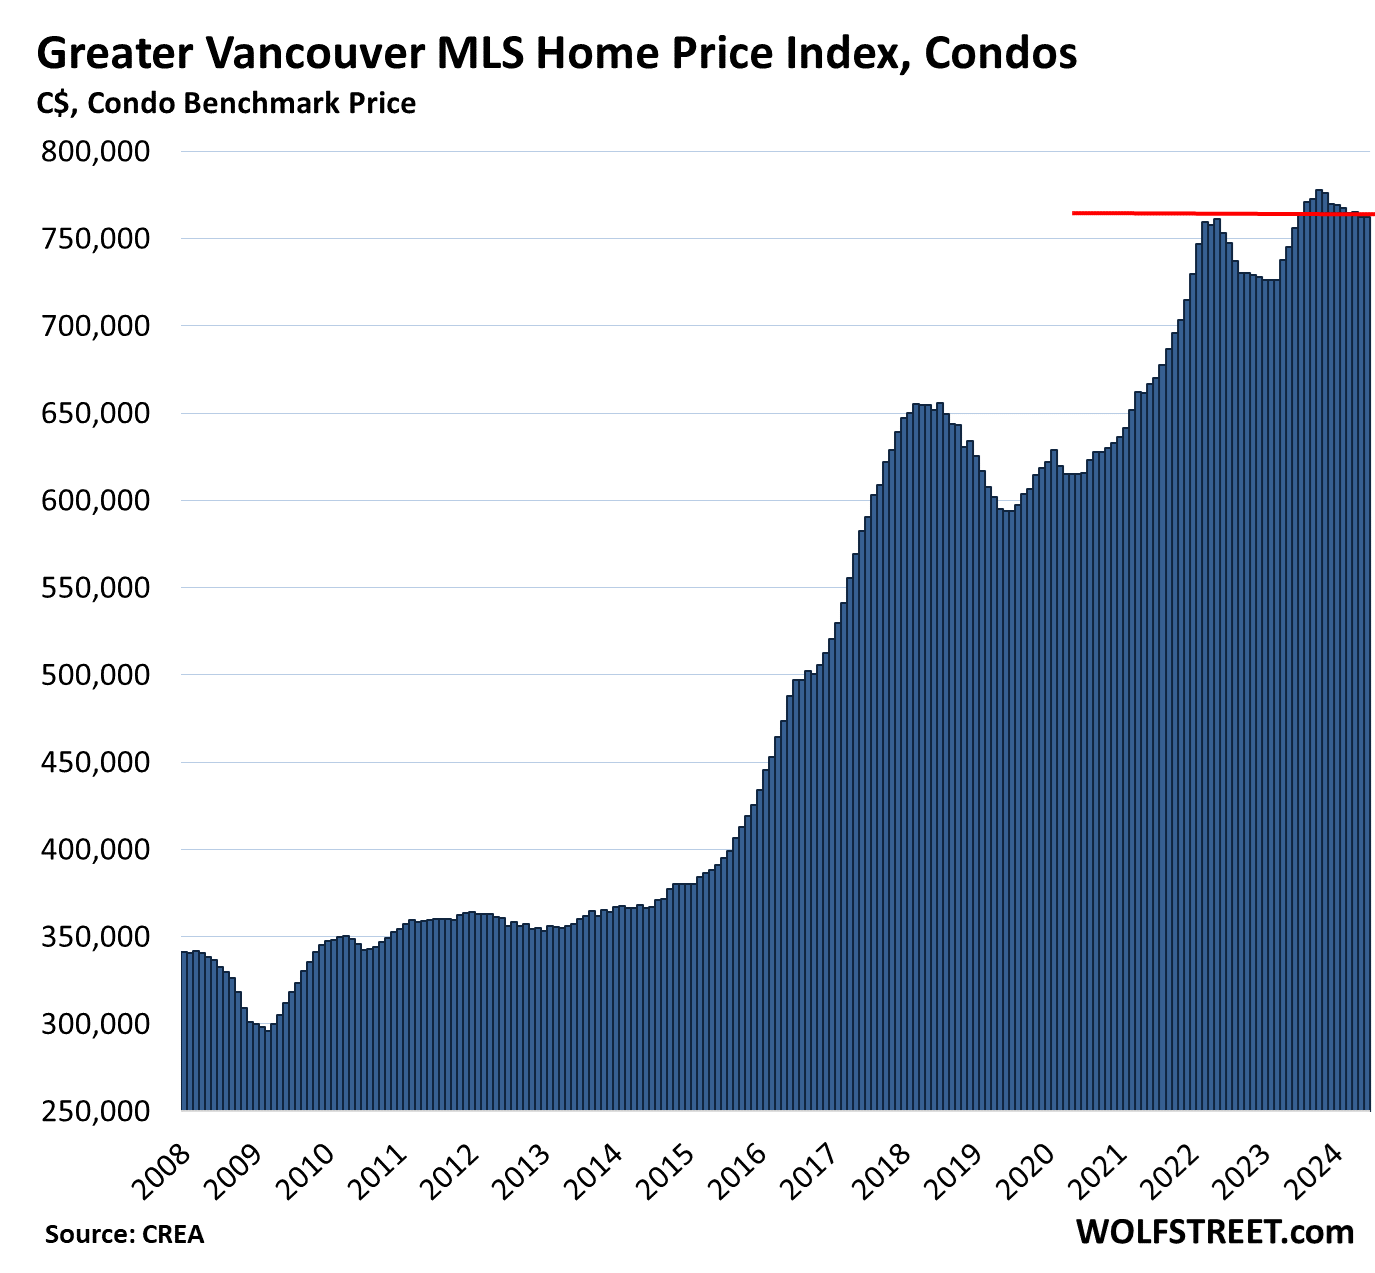
Greater Vancouver condo benchmark price:
- Month-to-month: unchanged, at $762,500, a hair above May 2022.
- Year-over-year: +0.9%, smallest gain since June 2023.
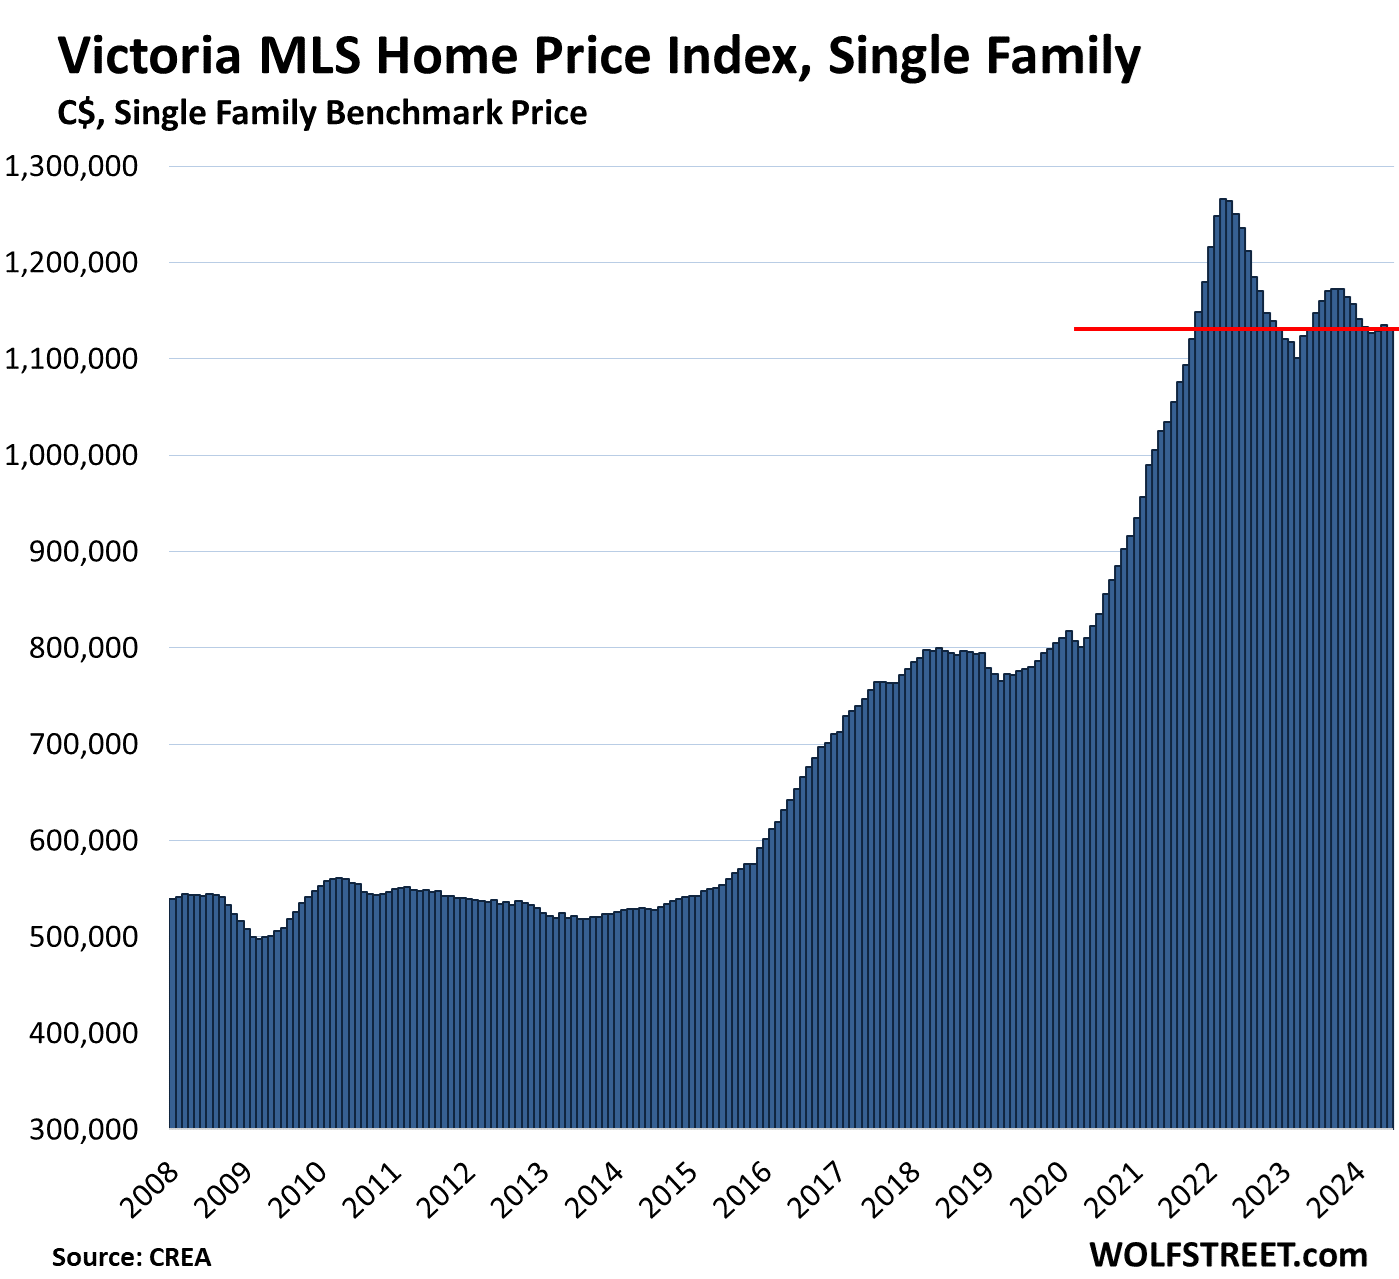
Victoria, single-family benchmark price:
- Month-to-month: -0.4%, to $1,130,700, below November 2021
- From peak in April 2022: -10.6%
- Year-over-year: -1.5% first year-over-year decline since August 2023.
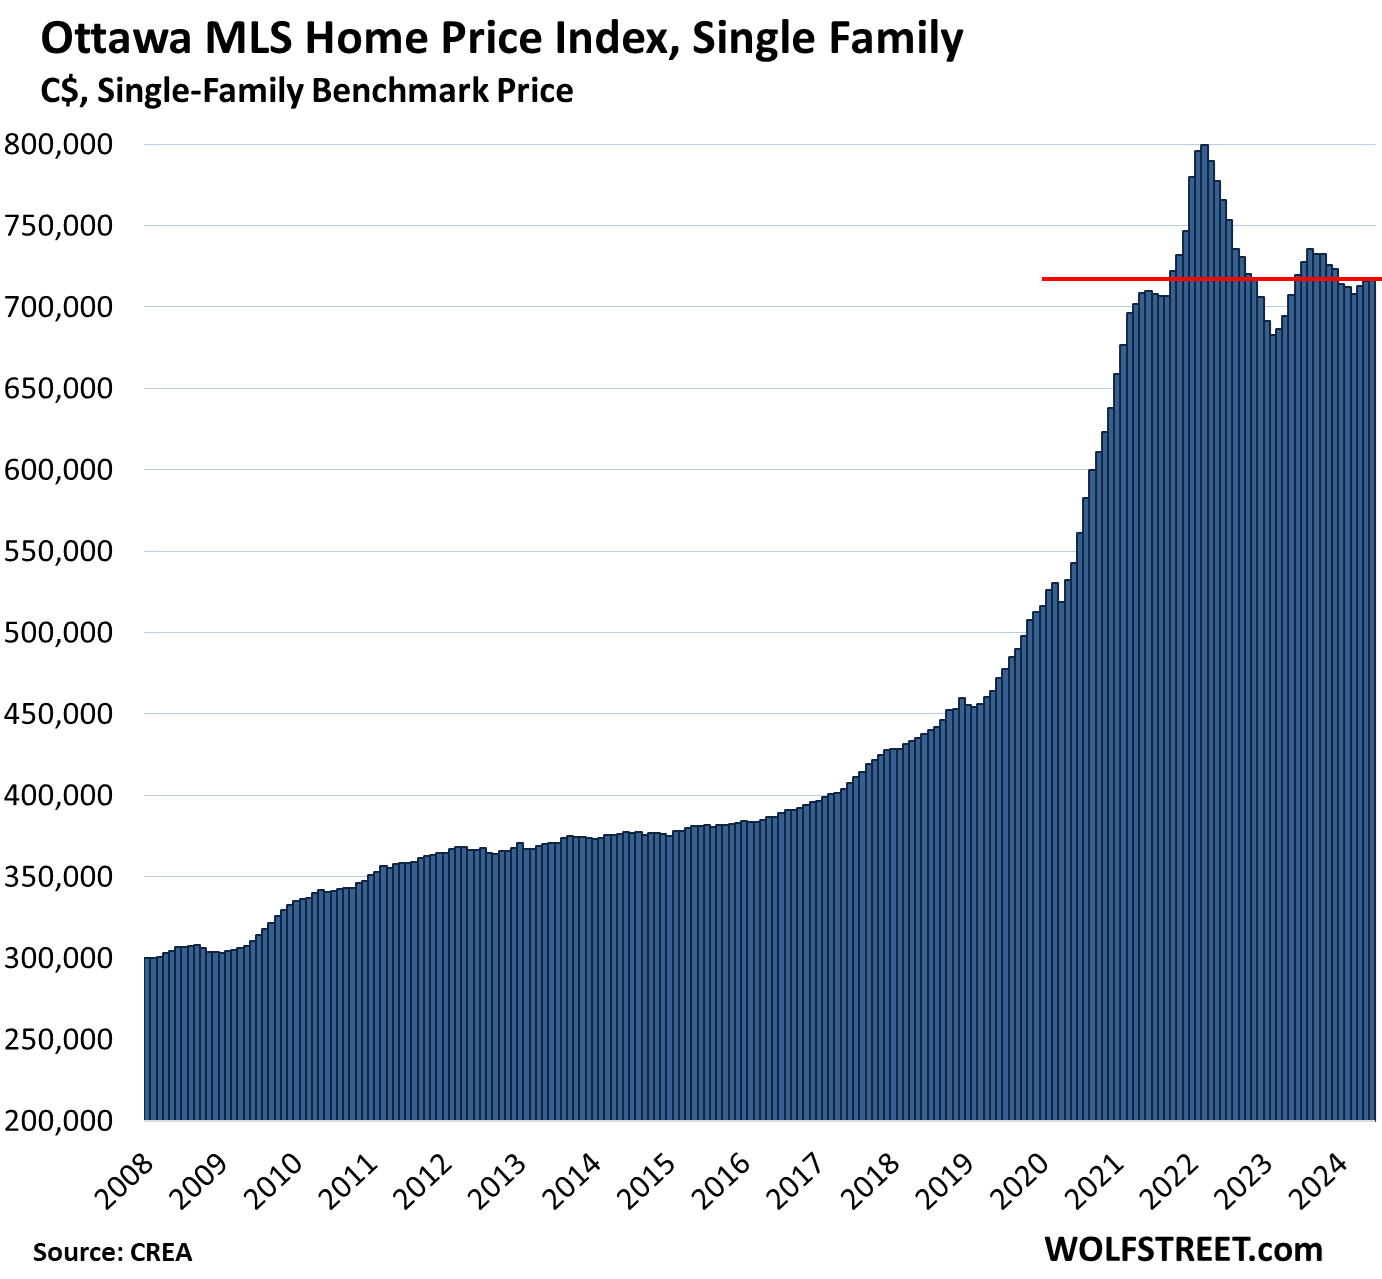
Ottawa, single family benchmark price:
- Month-to-month: +0.3% to $717,800, below October 2021
- From peak in March 2022: -10.3%
- Year-over-year: -0.3%, first year-over-year decline since July 2023.
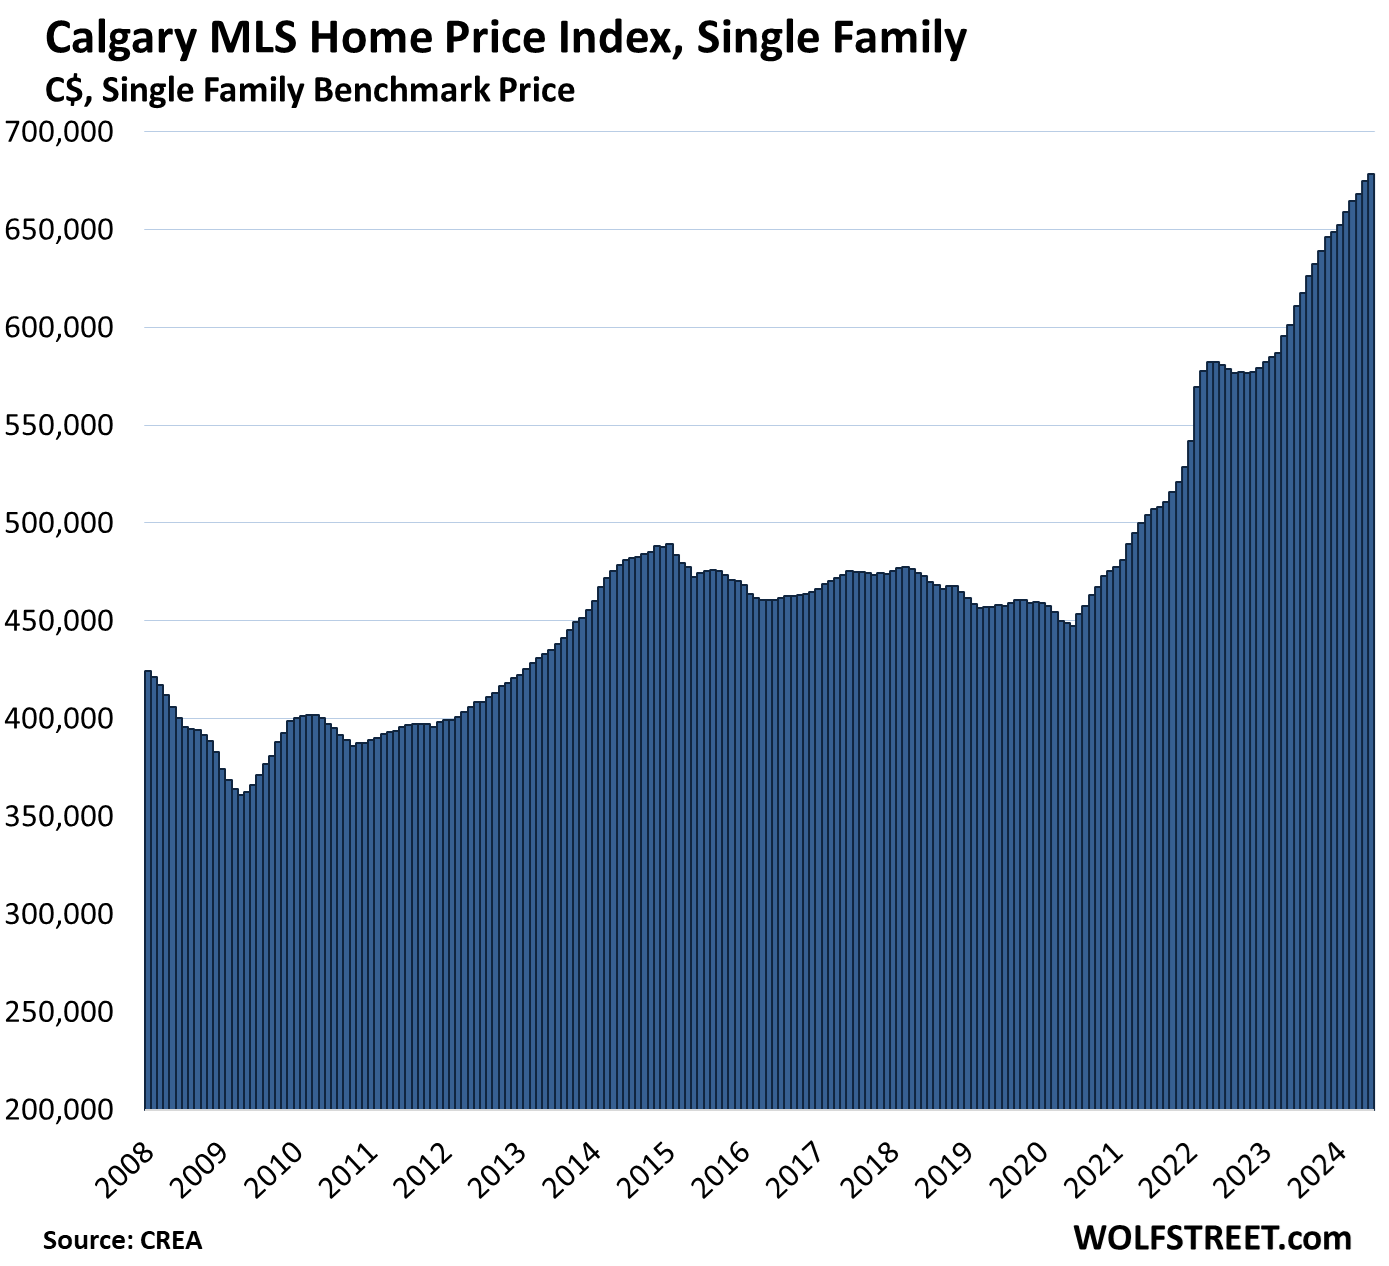
Calgary, single family benchmark price:
- Month-to-month: +0.5% to new high of $678,300
- Year-over-year: +11.3%. As big as this jump seems, it was the smallest since October 2023.
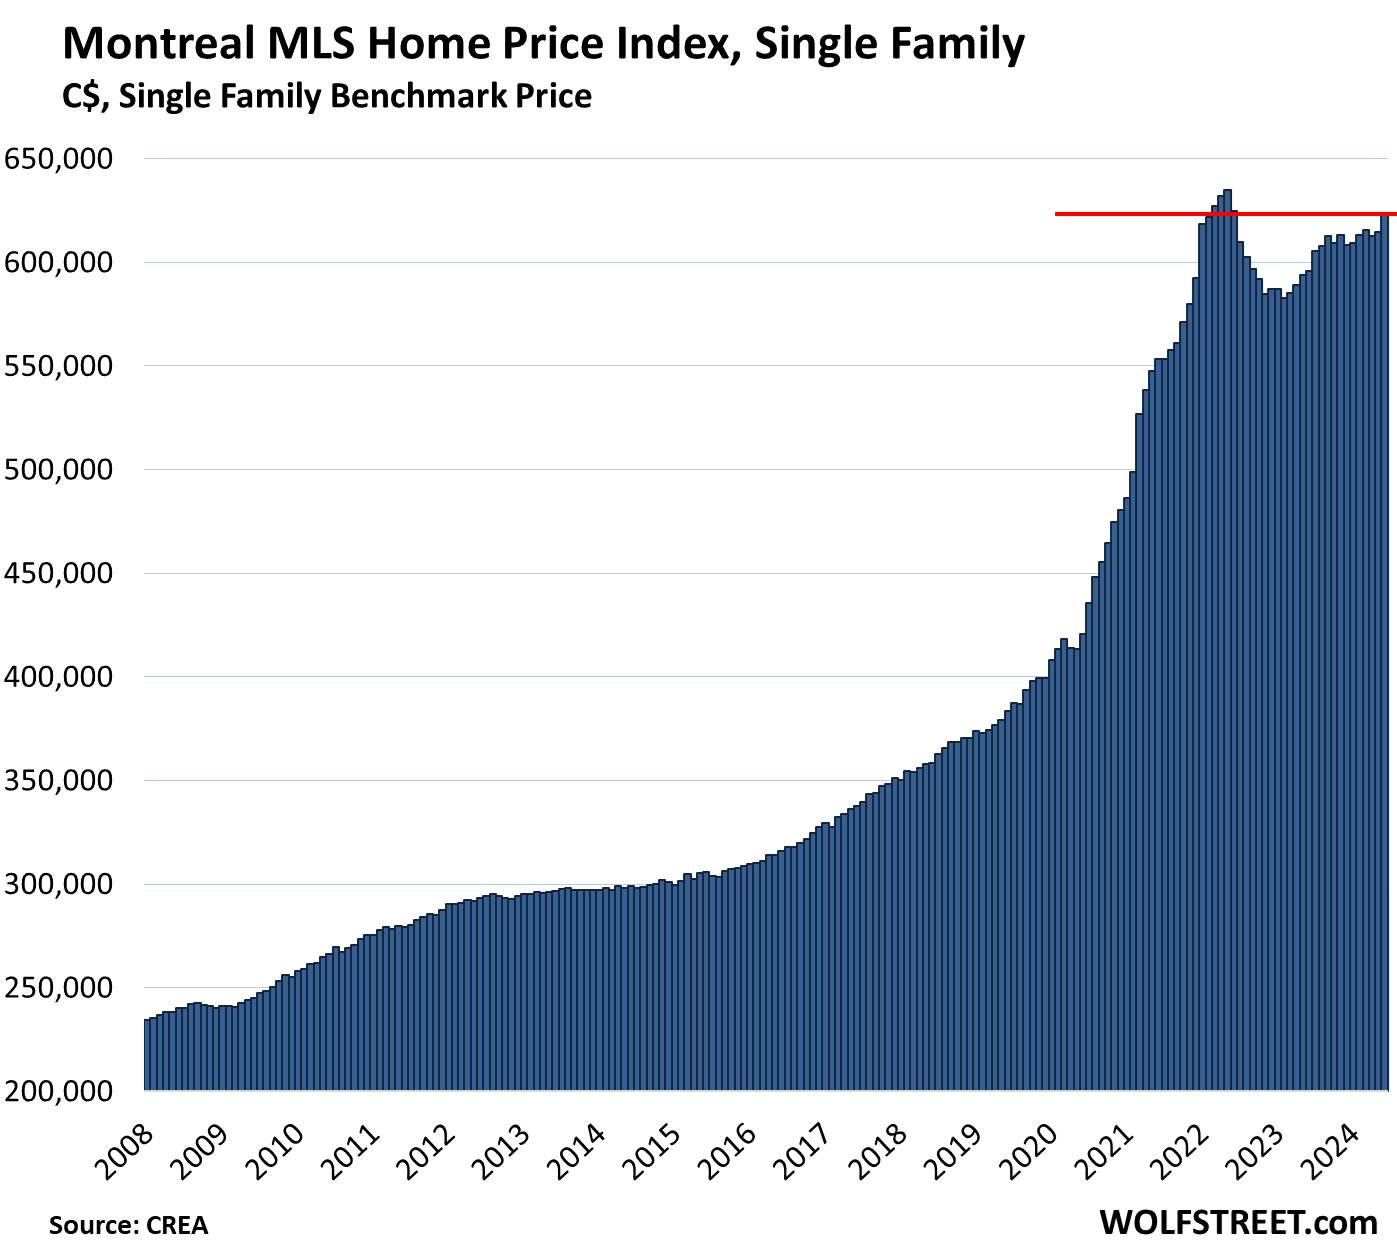
Montreal, single family benchmark price:
- Month-to-month: 1.4%, to $623,200, just a hair above February 2022.
- From peak in May 2022: -1.8%
- Year-over-year: +4.6%.
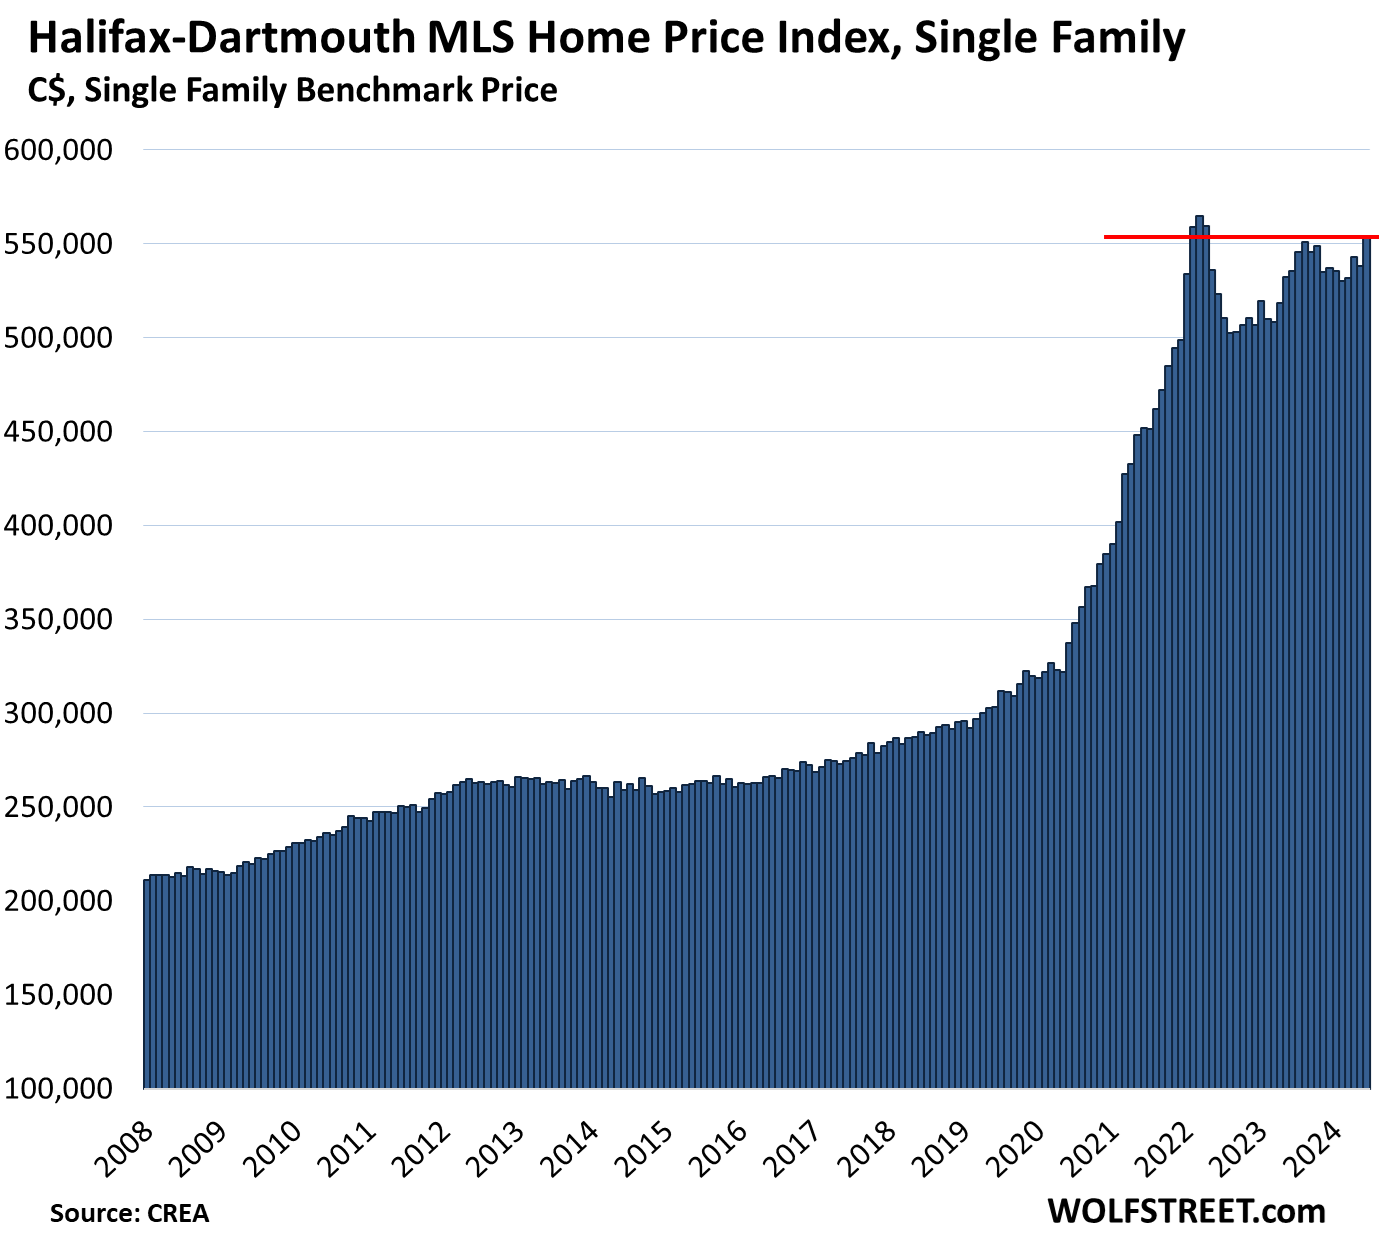
Halifax-Dartmouth, single family benchmark price:
- Month-to-month: +2.9% to $554,200
- From peak in February 2022: -0.8%
- Year-over-year: +3.5%.
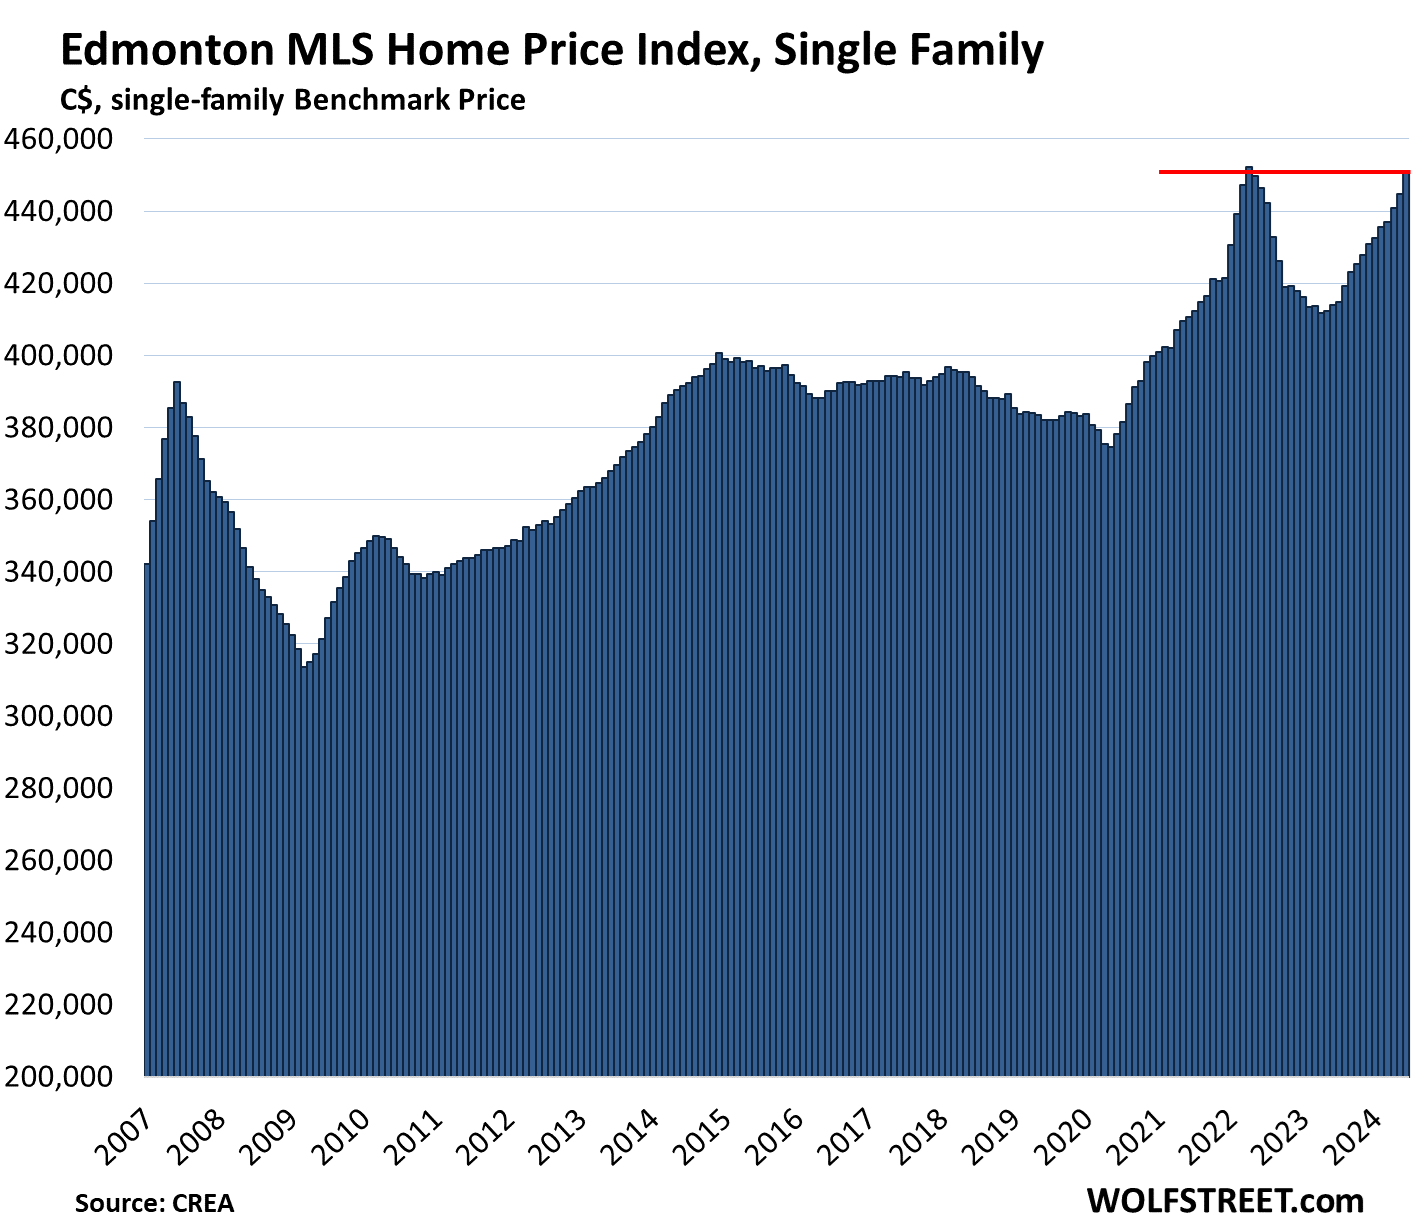
Edmonton, single-family benchmark price:
- Month-to-month: +1.3% to $450,700
- From peak in April 2022: -0.3%
- Year-over-year: +8.9%
- In the 17 years since the peak of the prior bubble in June 2007, the index is up 15%.
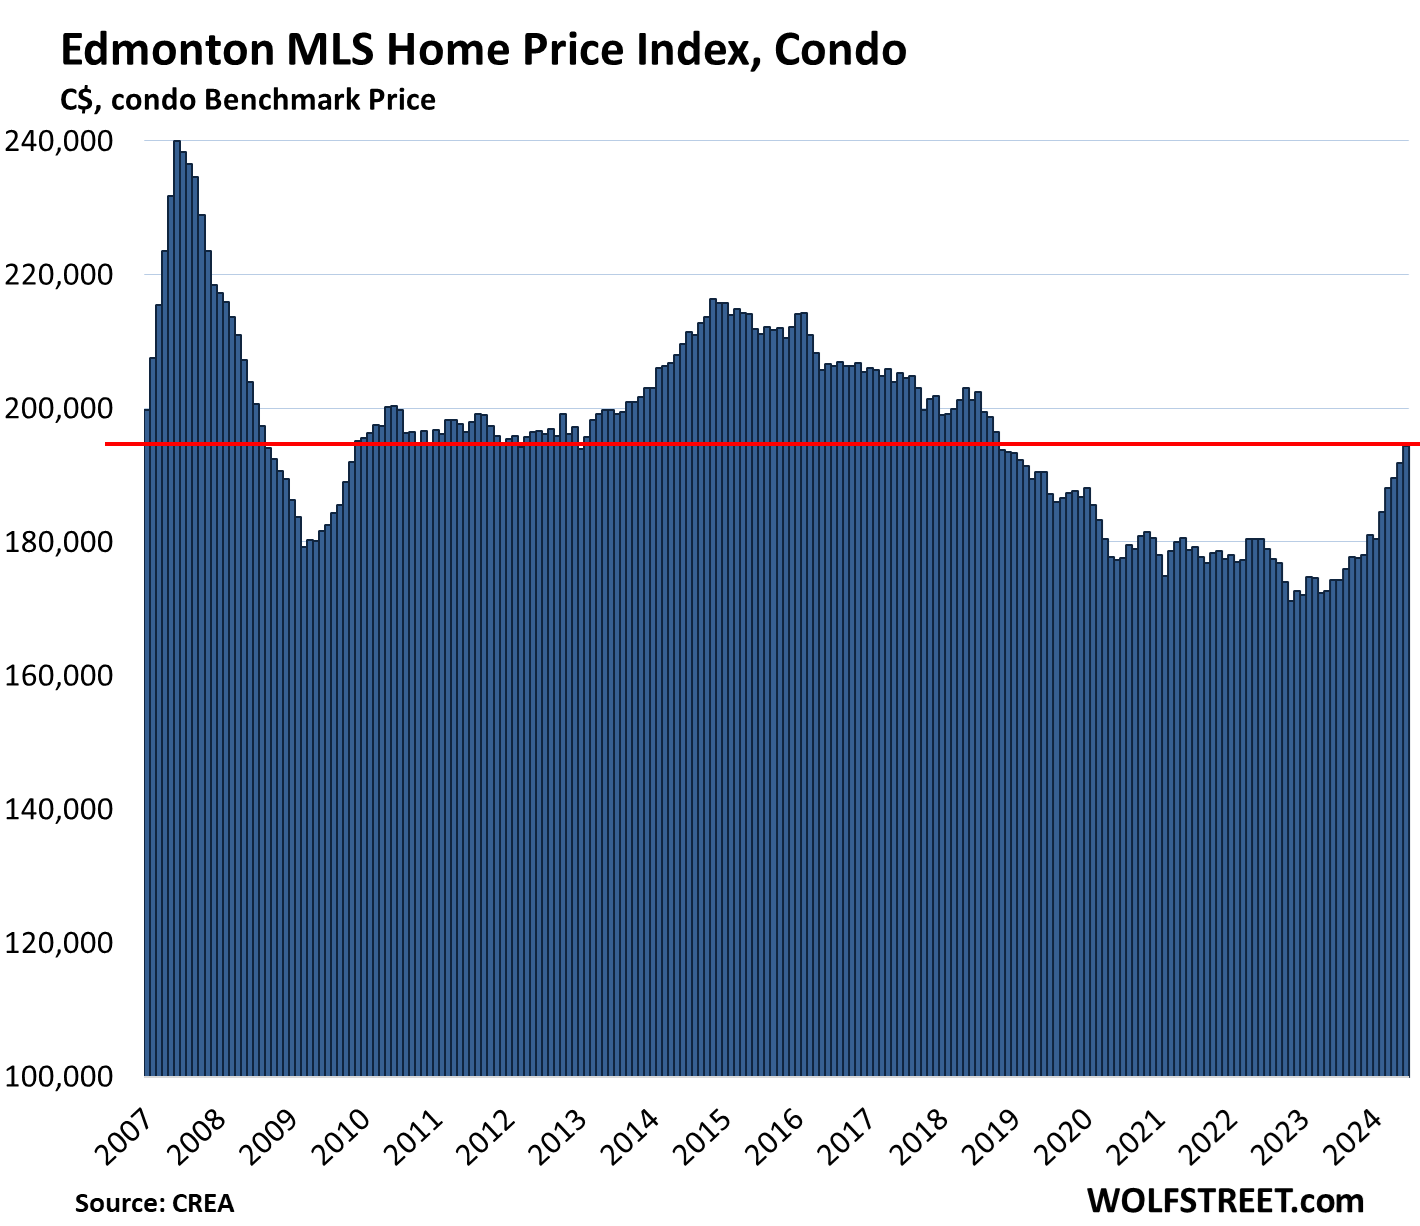
Edmonton, condo benchmark price: What an epic condo bubble looks like afterwards. Despite the surge in recent years, the index is down 19% from the peak in June 2007.
- Month-to-month: +1.3% to $194,300, first seen in December 2006.
- From peak in June 2007: -19%
- Year-over-year: +11.5%
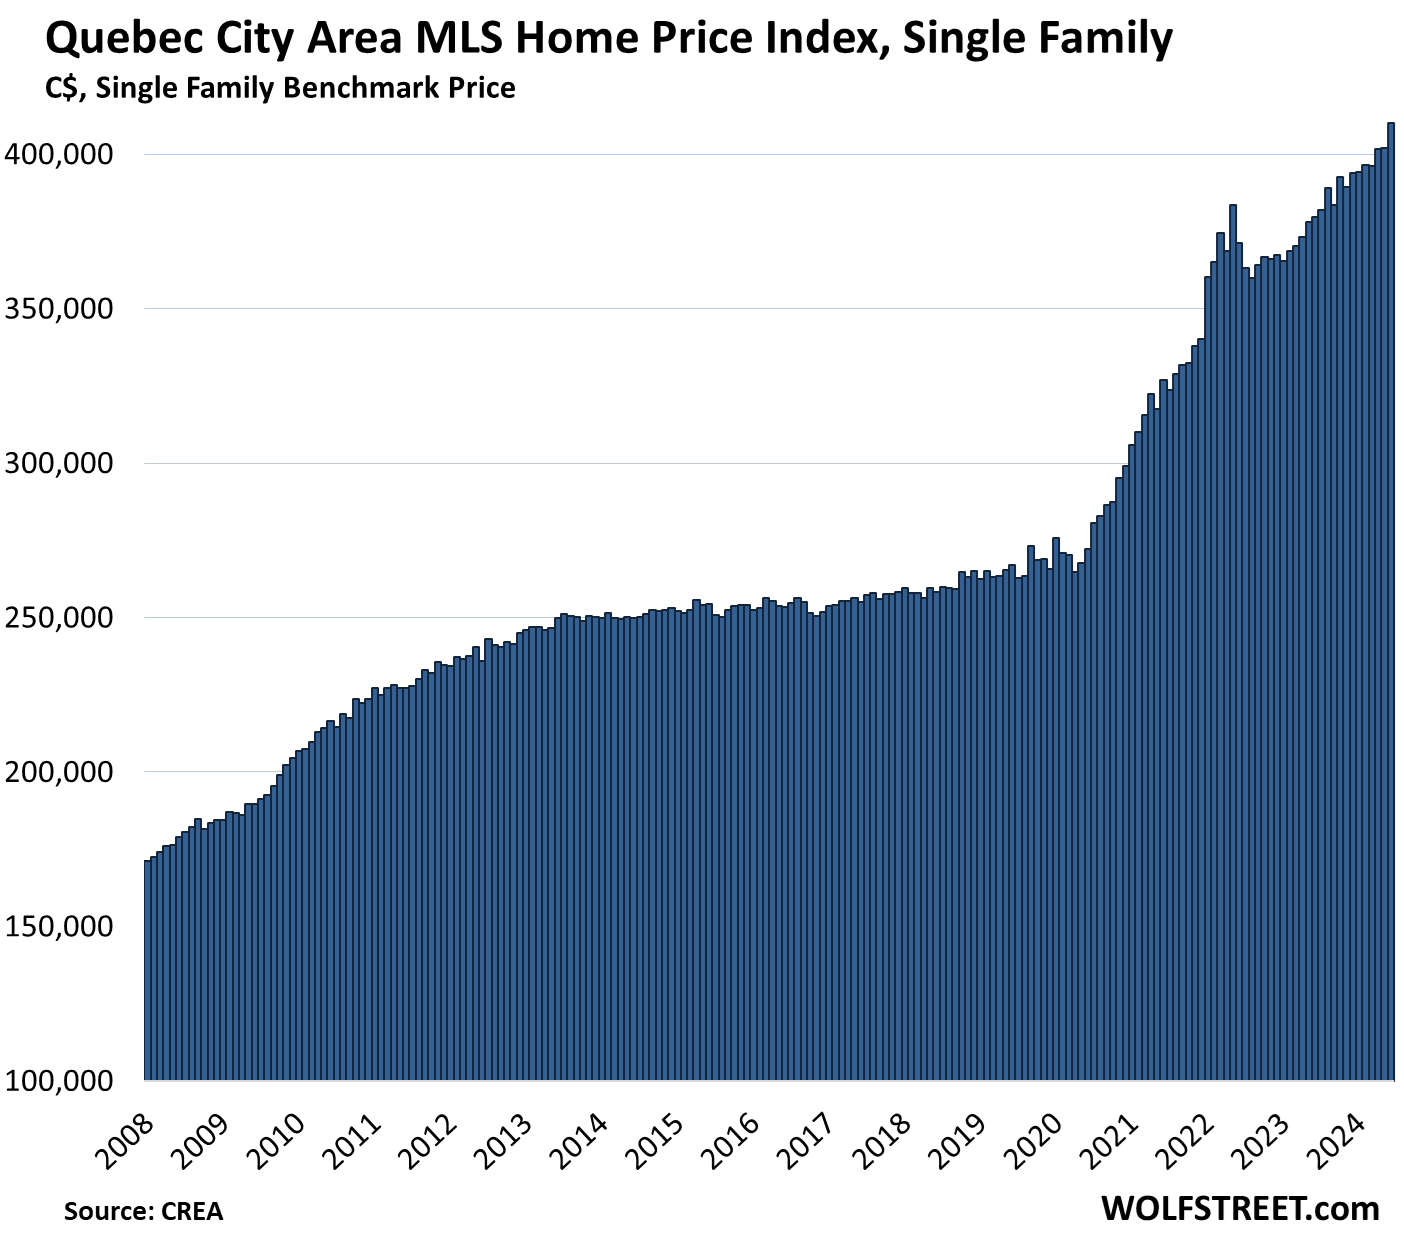
Quebec City Area, single-family benchmark price:
- Month-to-month: +2.0% to $410,000, a new high
- Year-over-year: +8.0%
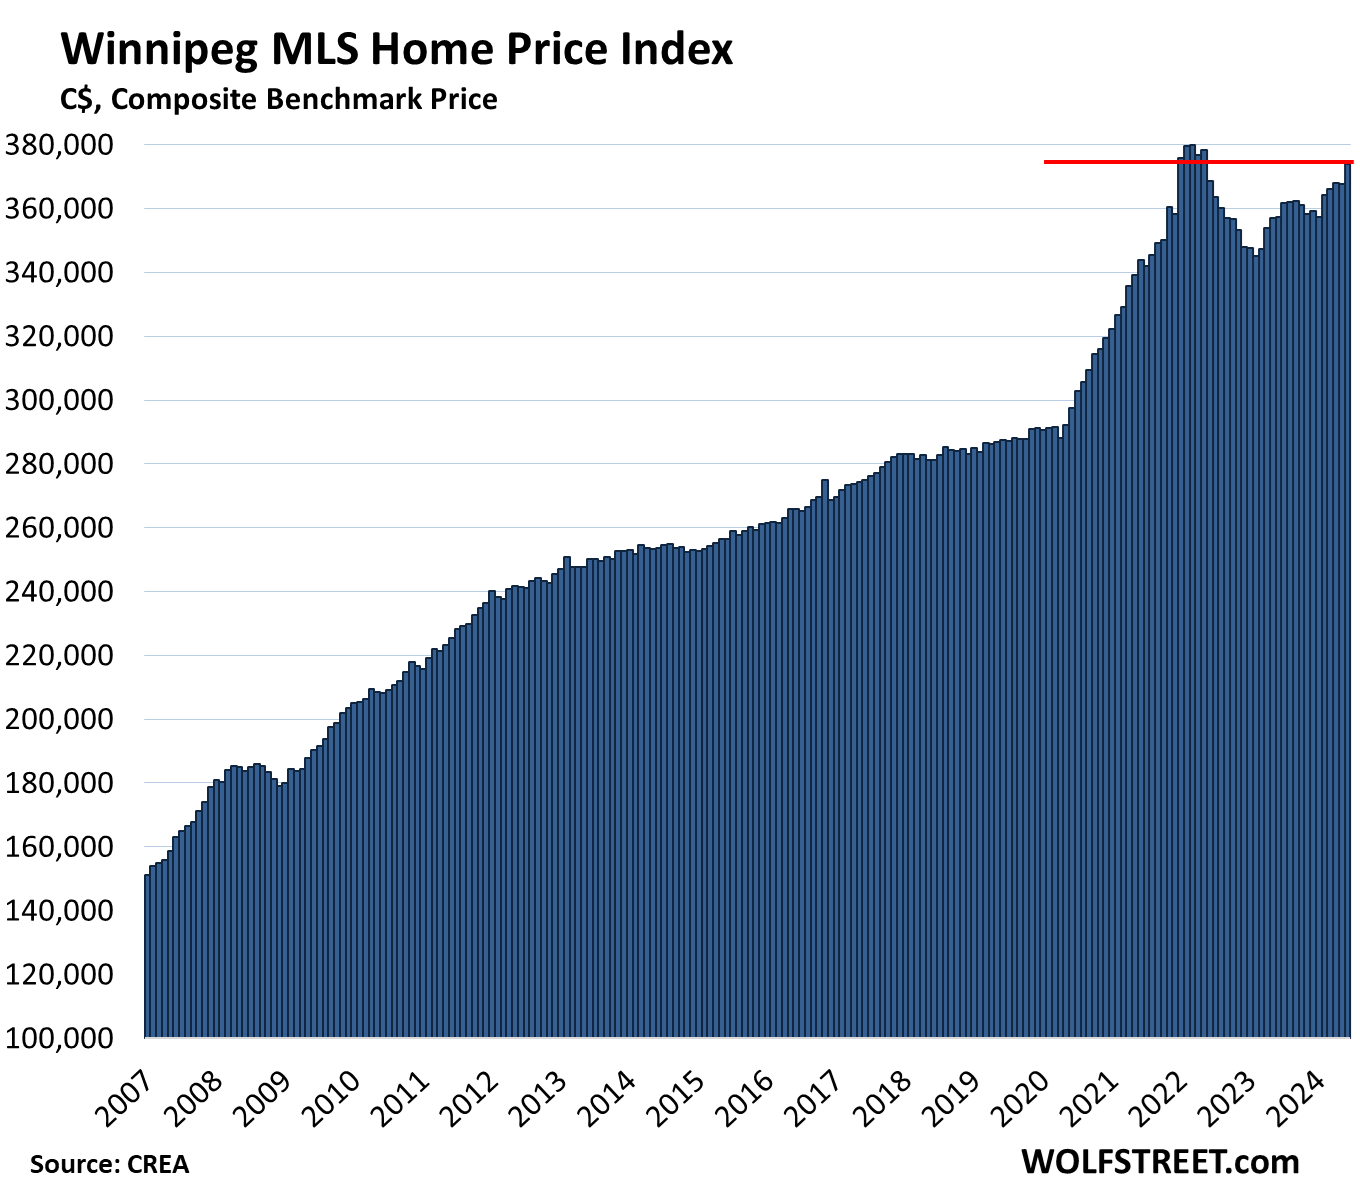
Winnipeg, single-family benchmark price:
- Month-to-month: +1.7% to $374,100
- From peak in March 2022: -1.6%
- Year-over-year: +4.6%
Enjoy reading WOLF STREET and wa
STAY INFORMED! Receive our Weekly Recap of thought provoking articles, podcasts, and radio delivered to your inbox for FREE! Sign up here for the HoweStreet.com Weekly Recap.
Wolf Richter July 12th, 2024
Posted In: Wolf Street