The S&P CoreLogic Case-Shiller Home Price Indices, released today for “May,” are three-month moving averages of home prices in 20 metropolitan areas whose sales were entered into public records in March, April, and May. So that’s the time frame.
Over this period, home prices in all 20 metros increased from the prior month, in most of them at a slower pace than in the prior two months, as home sales have plunged and active listings are now surging.
Prices were still below their 2022 highs in 7 of the Most Splendid Housing Bubbles (month of peak):
- San Francisco Bay Area: -7.3% (May 2022)
- Seattle: -4.9% (May 2022)
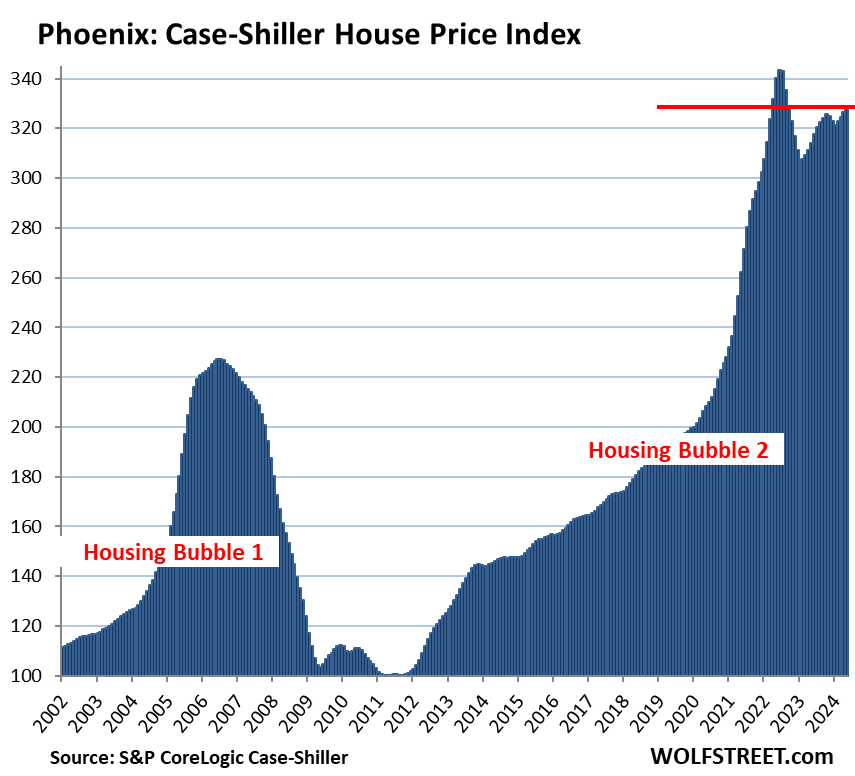
- Phoenix: -4.6% (June 2022)
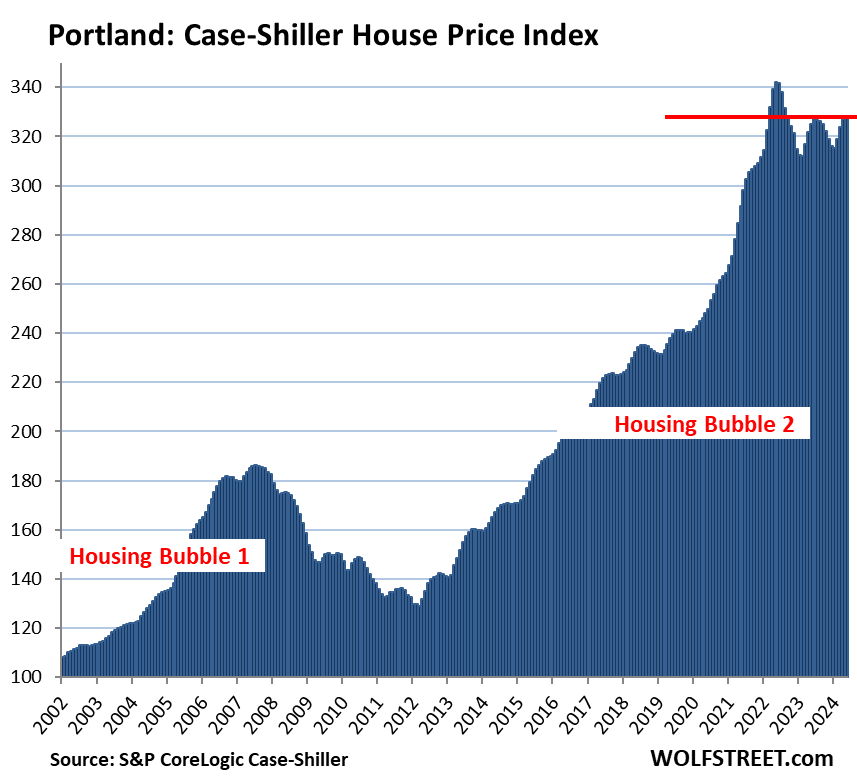
- Portland: -4.1% (May 2022)
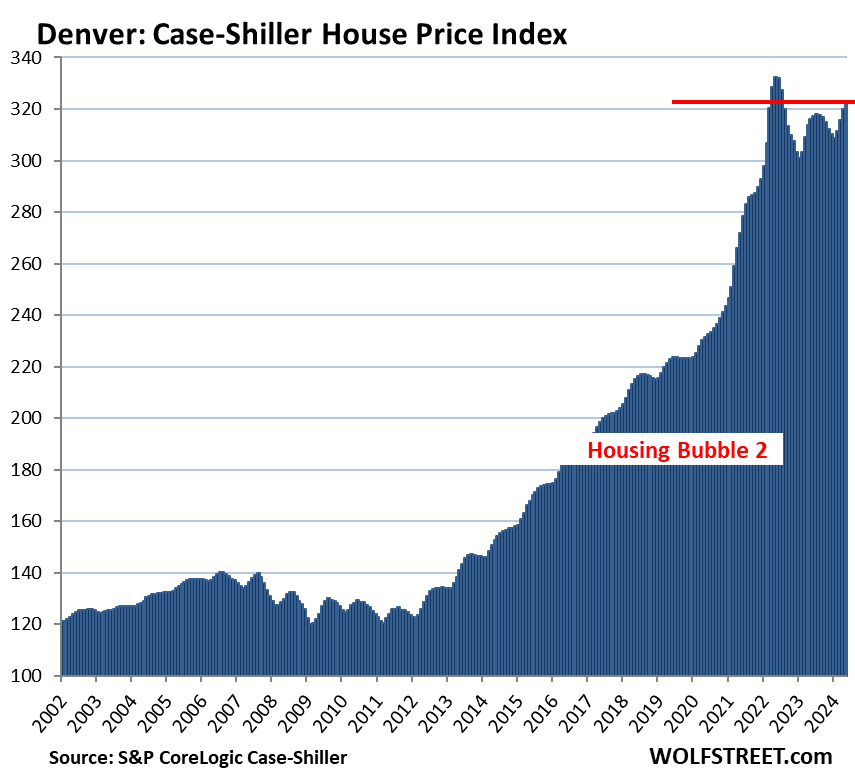
- Denver: -2.9% (May 2022)
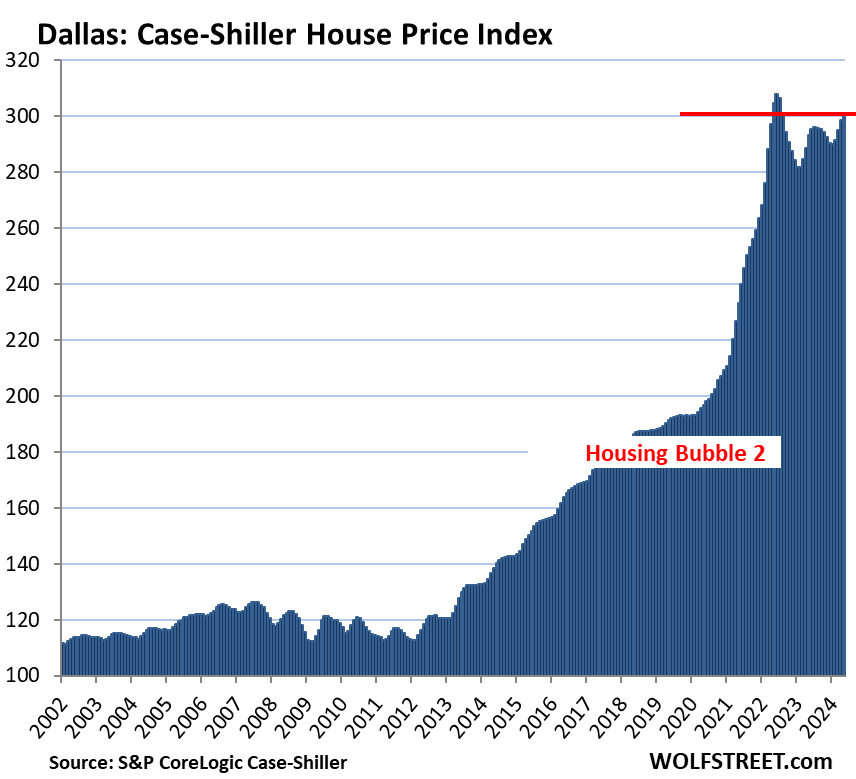
- Dallas: -2.3% (June 2022)
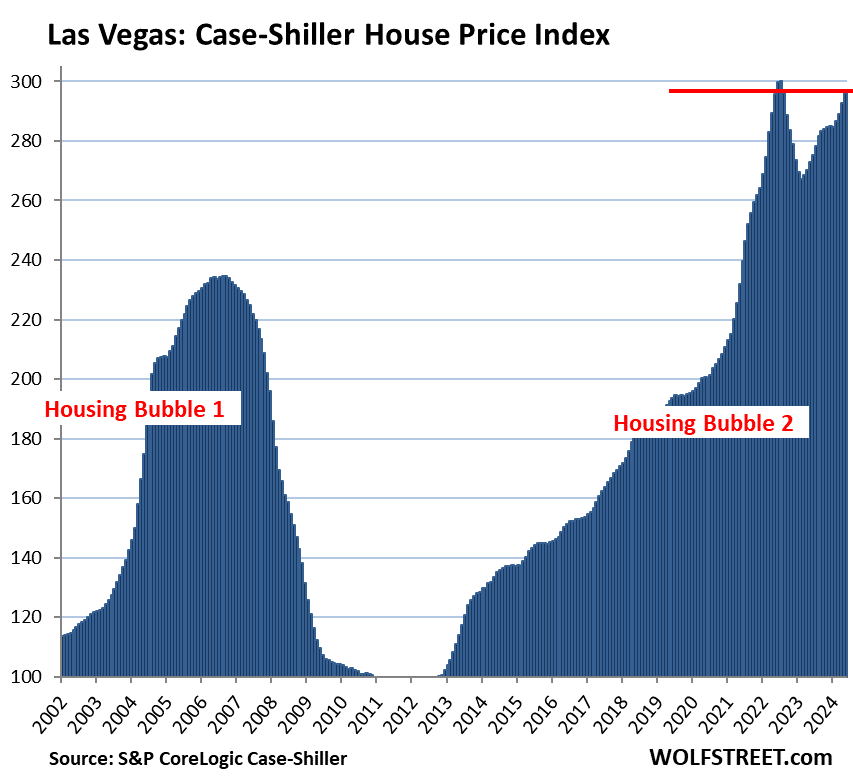
- Las Vegas: -1.3% (July 2022)
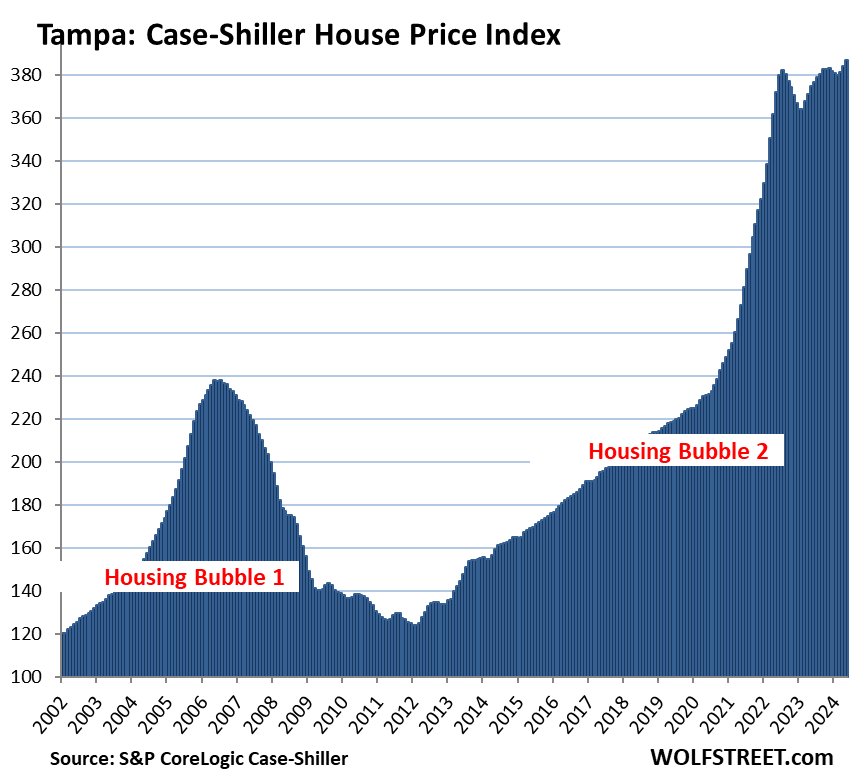
Prices set new highs in 8 of the Most Splendid Housing Bubbles, in some cases just a hair above their May/June 2022 highs. In terms of this 2-year time span among the 8 metros, gains ranged from 1.2% in Tampa to 11.6% in the New York metro.
The most splendid housing bubbles by metropolitan area.
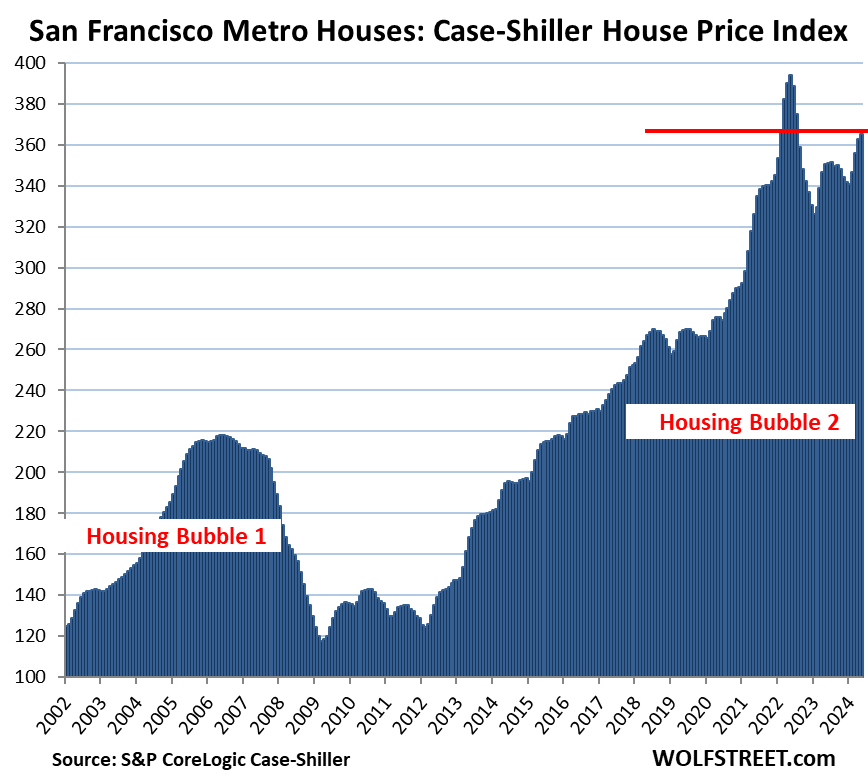
San Francisco Bay Area single family houses: the San Francisco metro in the Case-Shiller Index covers a five-county portion of the nine-county Bay Area.
- Month to month: +0.7%
- Year over year: +4.3%.
- From the peak in May 2022: -7.3%.
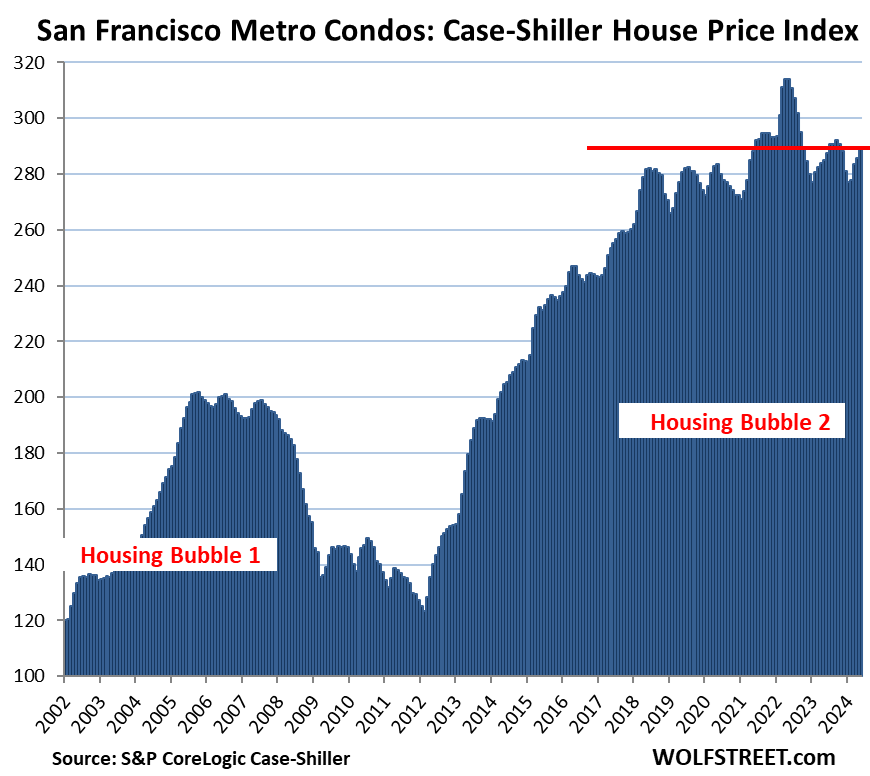
San Francisco Bay Area condos: Condos are a big part of the market in the Bay Area, particularly in San Francisco itself.
- Month to month: +1.2%.
- Year over year: +1.5%.
- From the peak in May 2022: -7.9%.
- Just a tad above May-August 2018.
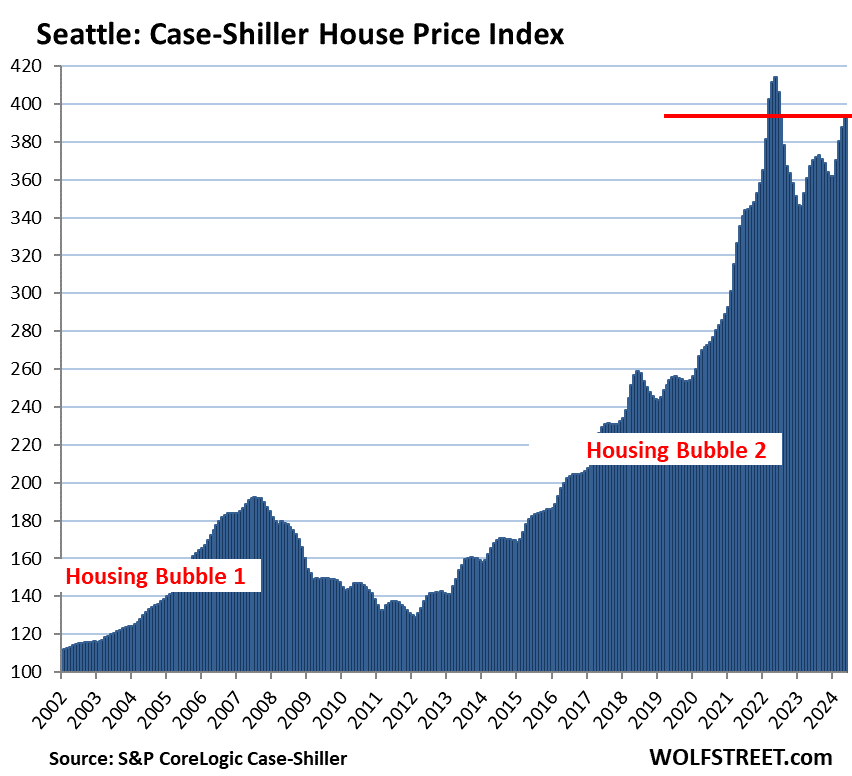
Seattle metro:
- Month to month: +1.4%.
- Year over year: +7.1%.
- From the peak in May 2022: -4.9%.
Phoenix metro:
- Month to month: +0.4%.
- Year over year: +4.4%.
- From the peak in June 2022: -4.6%.
Portland metro:
- Month to month: +0.3%.
- Year over year: +1.0%.
- From the peak in May 2022: -4.1%.
Denver metro:
- Month to month: +0.9%.
- Year over year: +2.1%.
- From the peak in May 2022: -2.7%.
Dallas metro:
- Month to month: +0.7%.
- Year over year: +2.6%.
- From the peak in June 2022: -2.3%.
Las Vegas metro:
- Month to month: +1.2%.
- Year over year: +8.6%.
- From the peak in July 2022: -1.3%.
Tampa metro:
- Month to month: +0.8%.
- Year over year: +3.3%.
- New high, +1.3% from July 2022 high.
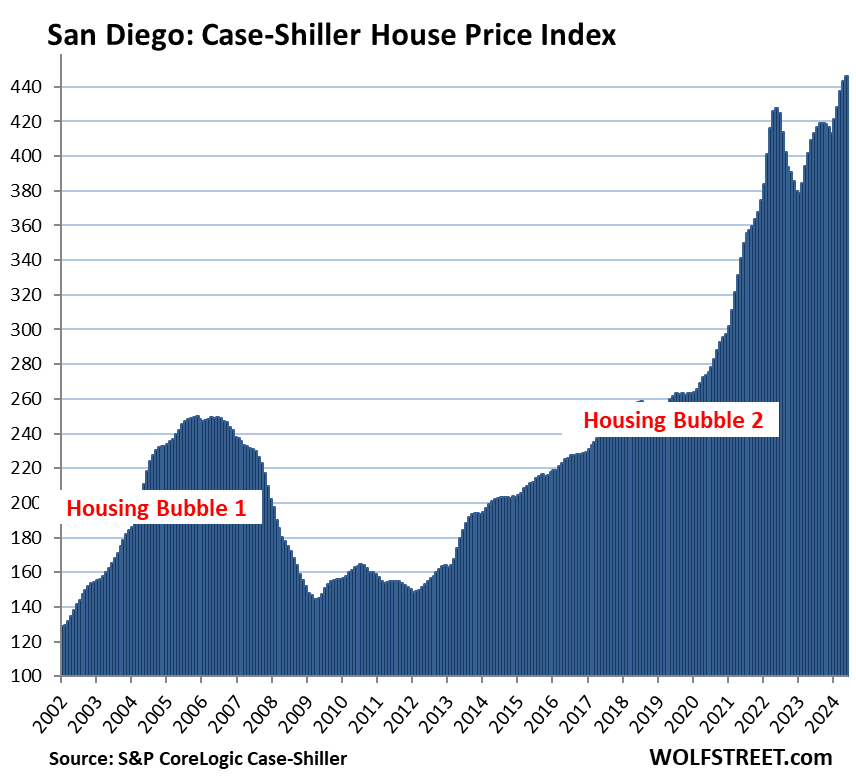
San Diego metro:
- Month to month: +0.7%.
- Year over year: +9.1%.
- New high, +4.0% from May 2022 high.
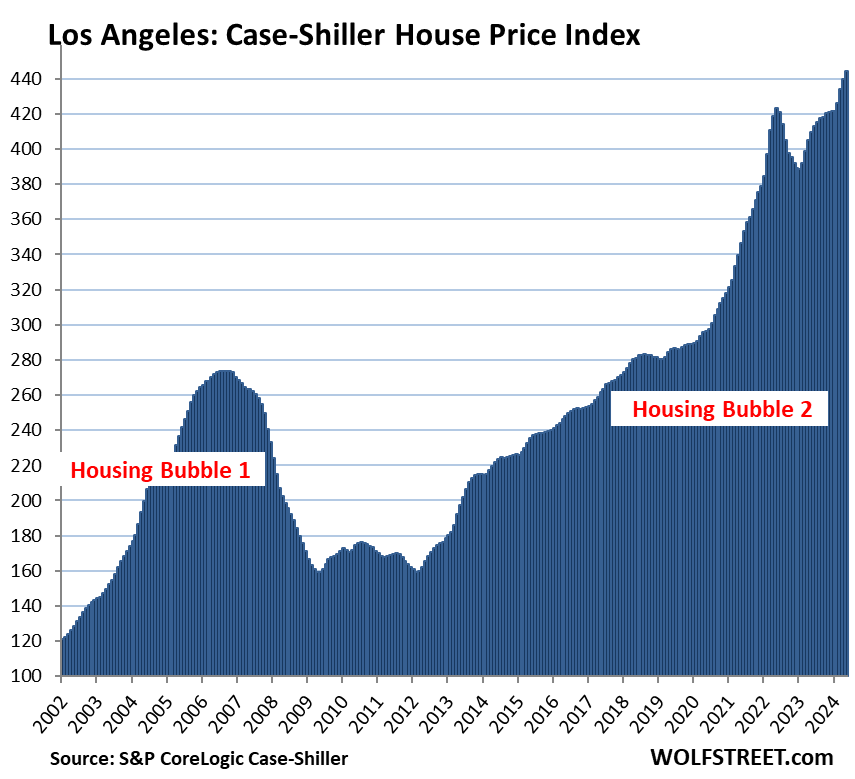
Los Angeles metro
- Month to month: +1.0%.
- Year over year: +8.4%.
- New high, +5.0% from May 2022 high.
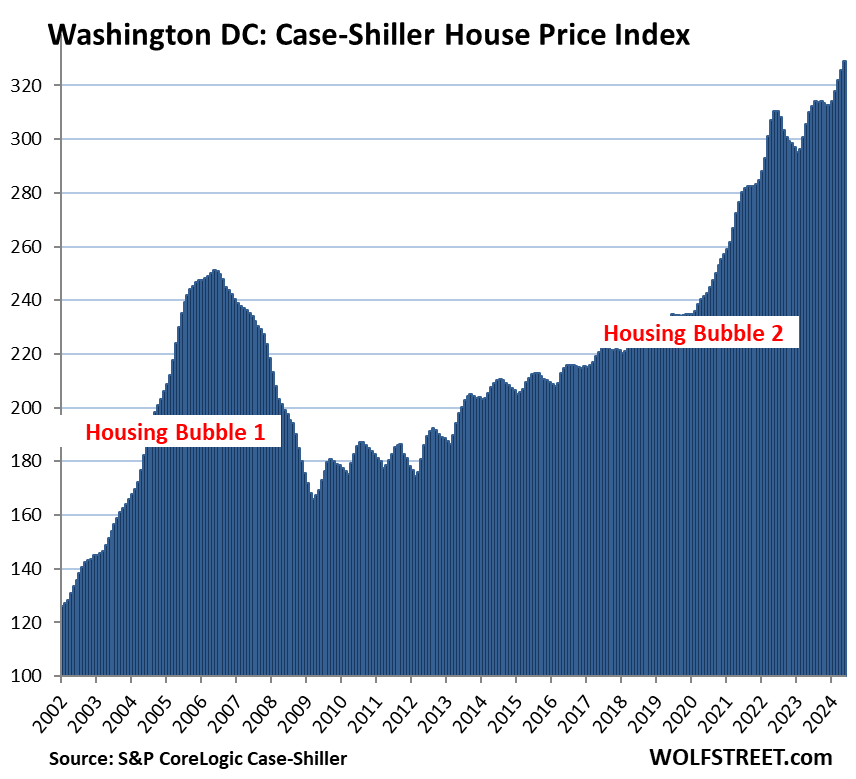
Washington D.C. metro:
- Month to month: +1.1%.
- Year over year: +6.1%.
- New high, +6.0% from June 2022 high.
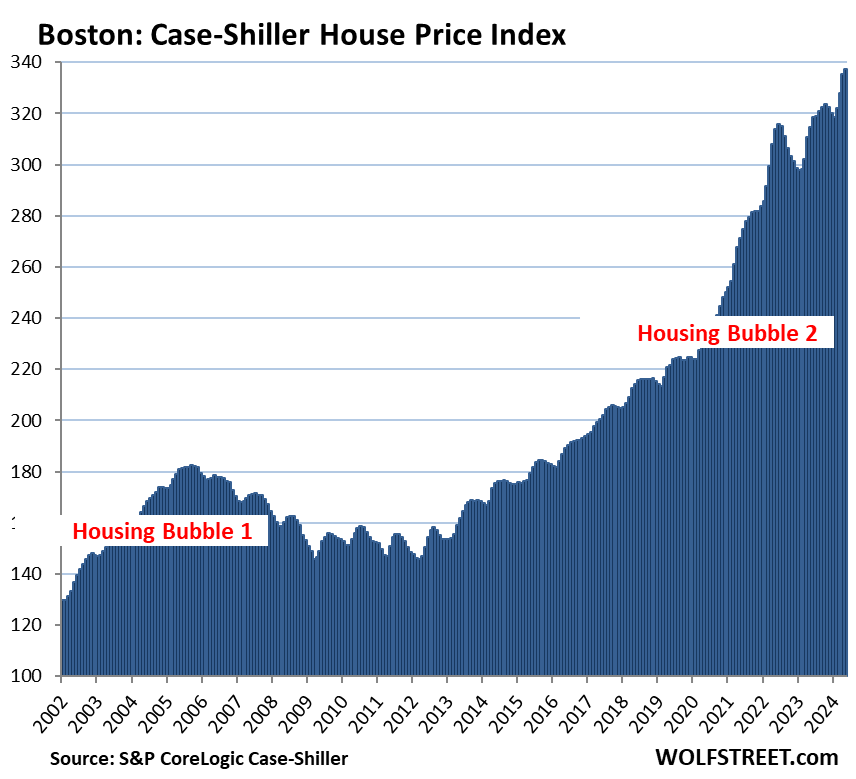
Boston metro:
- Month to month: +0.5%.
- Year over year: +7.2%.
- New high, +6.8% from June high 2022.
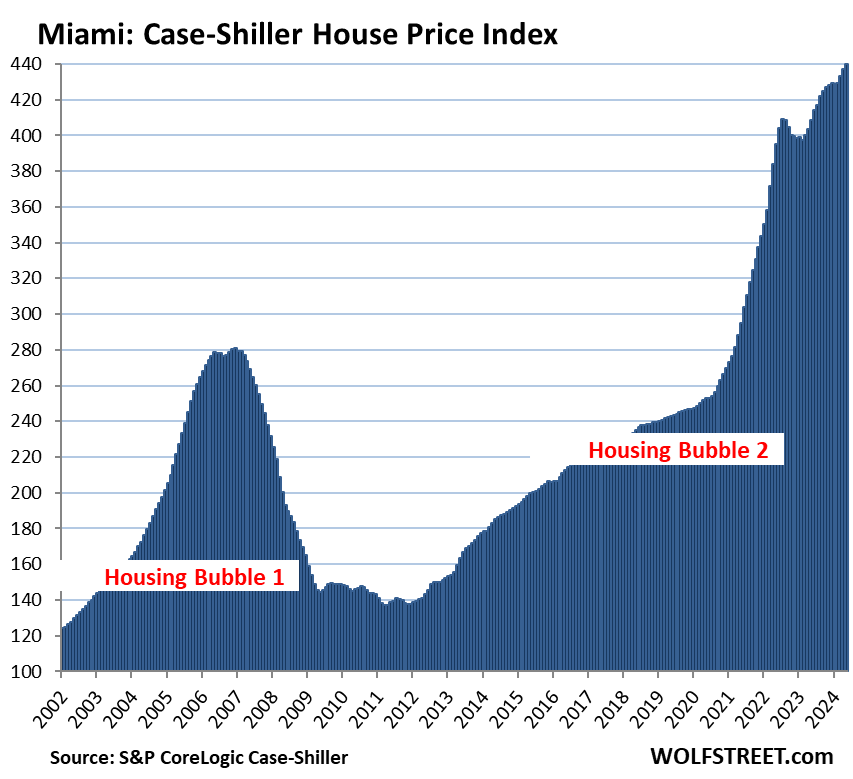
Miami metro:
- Month to month: +0.7%.
- Year over year: +7.6%.
- New high, +7.4% from July 2022 high.
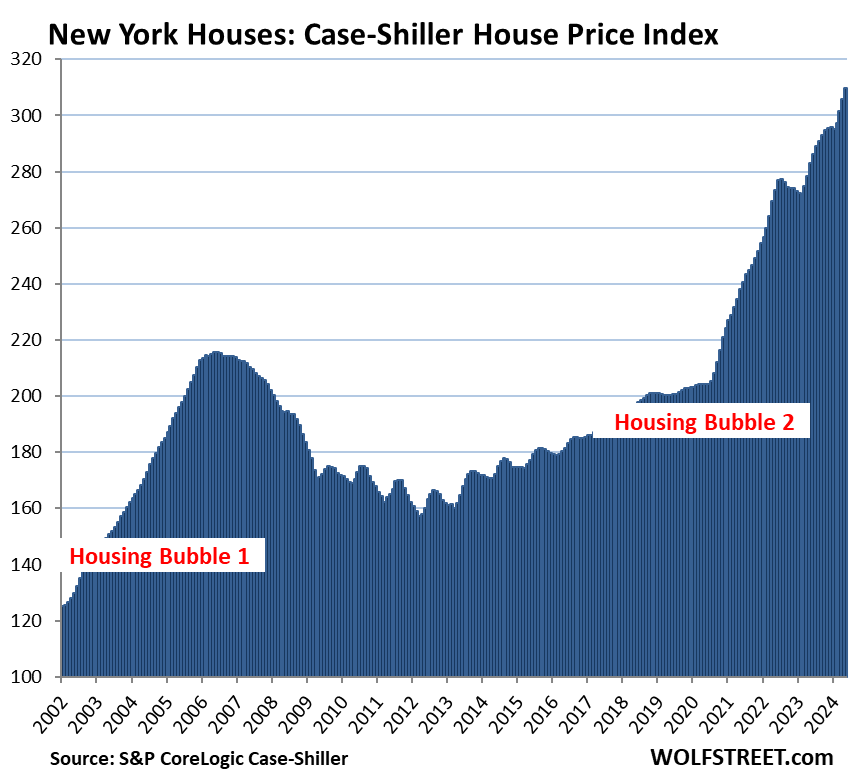
New York metro:
- Month to month: +1.3%.
- Year over year: +9.4%.
- New high, +13.2% from June 2022 high.
To qualify for the Most Splendid Housing Bubbles, the metro must have experienced home-price inflation since 2000 of 200% or more at the peak. The indices were set at 100 for the year 2000. Today’s index value for San Diego of 446 is up 346% since 2000, making San Diego the most splendid housing bubble on this list, ahead of Los Angeles (444) and Miami (440).
Methodology. The Case-Shiller Index uses the “sales pairs” method, comparing sales in the current month to when the same houses were sold previously. Price changes are weighted based on how long ago the prior sale occurred. Adjustments are made for home improvements and other factors (37-page methodology).
It’s home price inflation. By measuring how many dollars it takes to buy the same house over time, the Case-Shiller index is a measure of home-price inflation. San Diego had 346% home price inflation since 2000. Over the same period, consumer price inflation, as measured by CPI, amounted to 86%.
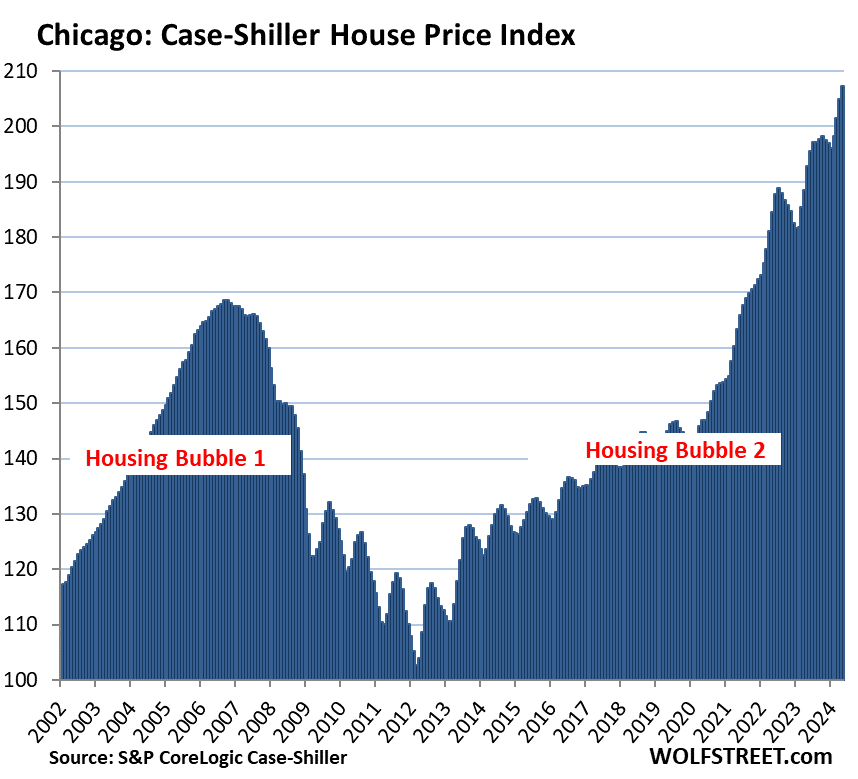
The remaining 6 of the 20 metros in the Case-Shiller index (Chicago, Charlotte, Minneapolis, Atlanta, Detroit, and Cleveland) had less home-price inflation since 2000 despite the price spikes in recent years, and don’t qualify for this list.
Chicago metro – includes 8 counties: Cook, DeKalb, Du Page, Grundy, Kane, Kendal, McHenry, and Will – has an index value of 207 and is up by 107% from the year 2000, and is therefore far from qualifying for this list. But the 46% price spike since the Fed started its money-printing binge in March 2020 has been sufficiently splendid, and it’s such a huge metro, so here it is anyway:
- Month to month: +1.1%
- Year over year: +7.5%.
- New high, +9.7% from July 2022 high.