ALWAYS CONSULT YOUR INVESTMENT PROFESSIONAL BEFORE MAKING ANY INVESTMENT DECISION

July 26, 2024 | Large Upward Revisions of “Core Services” PCE Inflation Pushed Six-Month “Core” PCE Inflation to 3.4%, Worst in a Year

Wolf Richter


The revisions, the upward revisions, oh-la-la! The Bureau of Economic Analysis released today the PCE price index for June; and as part of it, the “core” PCE price index – the Fed’s primary yardstick for inflation – was revised substantially higher for May, driven by a large upward revision of the “core services” PCE price index. So the much-hailed month-to-month core PCE reading a month ago of +1.0% annualized (+0.08% not annualized) was revised up to +1.5% annualized (+0.13% not annualized).
Then in June, core PCE accelerated further from that upwardly revised pace, to 2.2% annualized (0.18% not annualized). Part of the hotter than expected month-to-month reading for June was the index for durable goods, which was 0% in June, after the “freak plunge,” as we called it, of 9.1% in May, the biggest month-to-month drop since 2001.
The six-month annualized core PCE price index, which irons out most of the squiggles and includes all the revisions, and which Powell cites a lot, accelerated to 3.4%, the worst since June 2023 (red). The Fed’s target is 2% (for your amusement, here is the unrevised chart through May from our report a month ago):
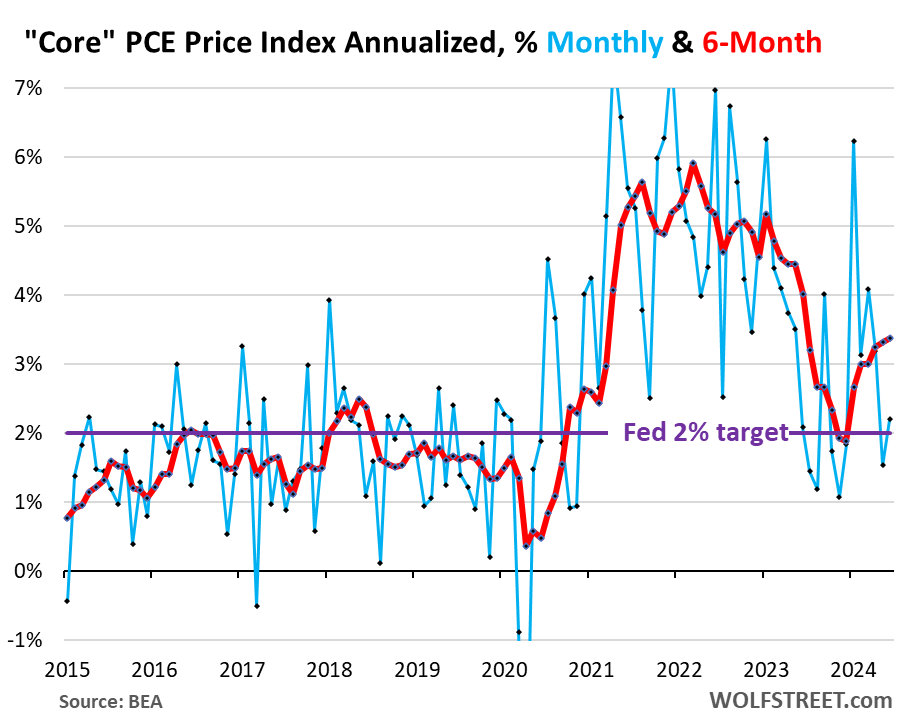
“Core PCE” v. “Core CPI.” Something interesting has happened – a fairly rare occurrence: The six-month Core PCE price index here, rising by 3.4% for June, is now higher than the six-month Core CPI for June, which had decelerated for the second month in a row, and in June rose by 3.3%. Normally, the core CPI is significantly higher than the core PCE price index. But not right now.
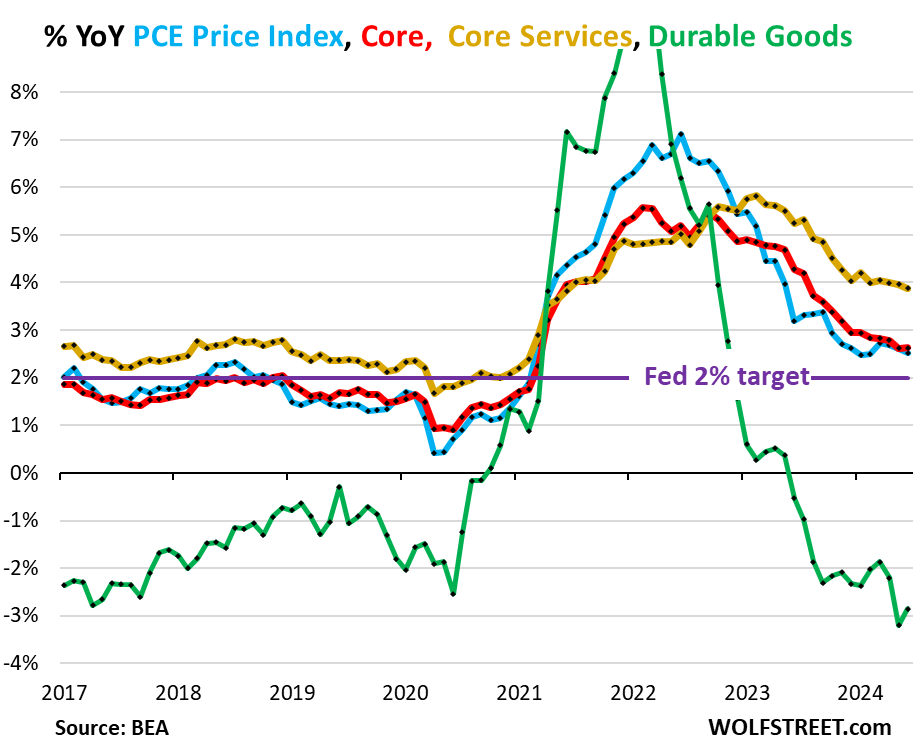
In summary, year-over-year:
Overall PCE price index, which includes food and energy, rose by 2.5% in June from a year ago, a deceleration from May (+2.6%), but the same as in January and February. It has essentially been stuck in this 2.5% to 2.6% range all year (blue in the chart below).
Gasoline and other energy products fell further in June from May, and were nearly flat year-over-year; and food prices were essentially flat for the past four months, and up 1.4% year-over-year.
“Core” PCE price index, which excludes food and energy, rose by 2.6% in June year-over-year, same as in May (red). The Fed’s target for this metric is 2% (purple).
“Core services” PCE price index rose by 3.9% in June, same as the unrevised increase in May (+3.9%), but down a tad from the upwardly revised May increase (+4.0%), which was the same as April, March, and February (all +4.0%). The index has been in that 4.0% proximity since December (yellow).
Durable goods PCE price index fell by 2.9% year-over-year, a smaller drop than in May (-3.1%, which had been the biggest year-over-year drop since 2004 (green):
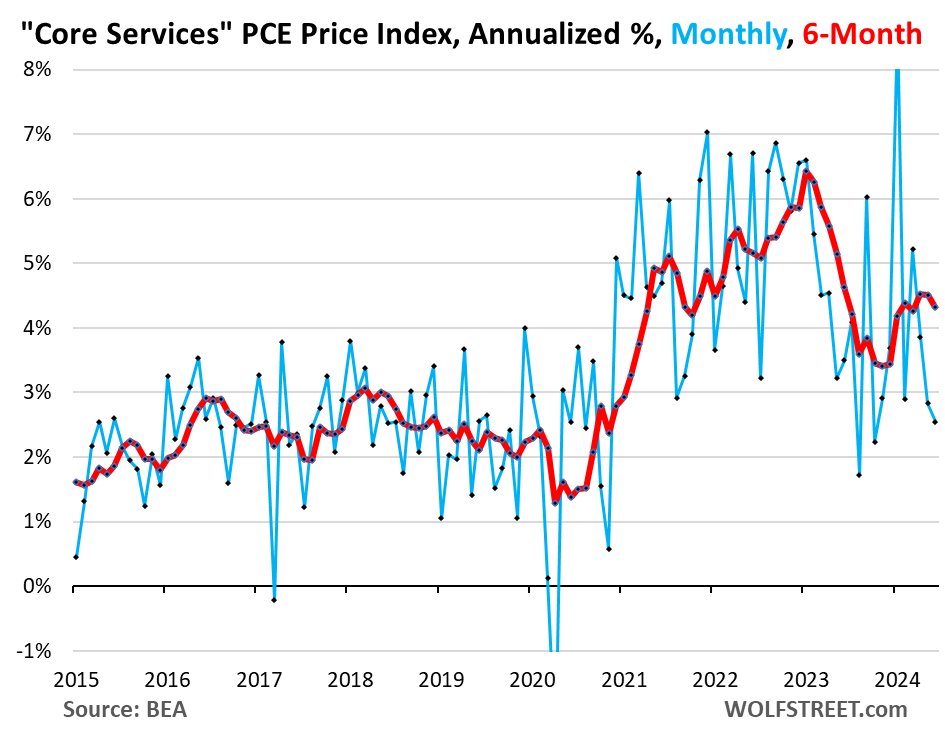
“Core Services” PCE price index is where the big revisions for May took place. In the data released a month ago, the index rose by 2.1% annualized in May from April. Today, the May increase was revised higher to +2.8%.
Then in June, the index increased by 2.5% annualized, according to today’s release. So that’s a deceleration from the revised May figure, but an acceleration from the original May figure.
This big upward revision in the month-to-month data caused the six-month core services index for May to be revised up to 4.5%, same as in April, up from the original 4.4%.
For June, the six-month core services PCE index rose by 4.3% annualized. It has been in the 4.3% to 4.5% range for the entire year so far – and up a full percentage point from the 3.4% range of the last three months of 2023 (red).
This inflation data rumbles along as the economy has solidly re-accelerated in Q2. Core services is where inflation has accelerated this year and it’s where the majority of consumer spending goes. It includes housing, healthcare, insurance, transportation services, communication services, entertainment, etc.
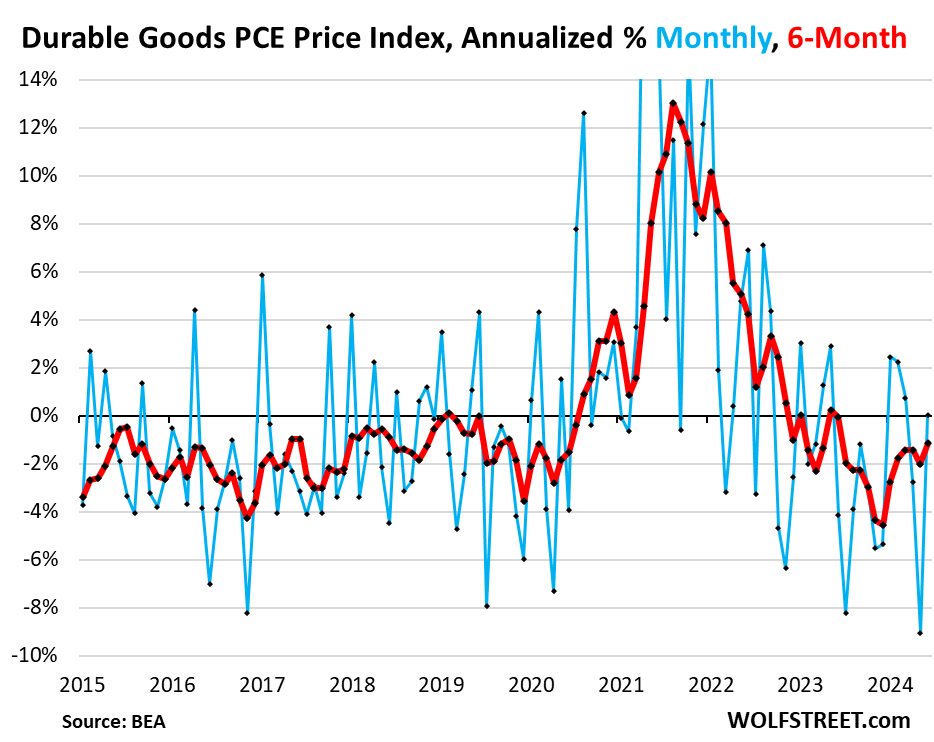
Durable goods PCE price index was unchanged in June from May, after the 9.1% annualized plunge in May from April, the biggest since 2001 (blue). Durable goods include motor vehicles, recreational goods and vehicles, appliances, electronics, furniture, etc.
The six-month index fell by 1.1% annualized, the smallest decline since June 2023 (red). The durable goods index tends to run in the slightly negative range during normal times amid manufacturing efficiencies and globalization.
STAY INFORMED! Receive our Weekly Recap of thought provoking articles, podcasts, and radio delivered to your inbox for FREE! Sign up here for the HoweStreet.com Weekly Recap.
Wolf Richter July 26th, 2024
Posted In: Wolf Street
Next: Tech Stocks Drop World Wide »