ALWAYS CONSULT YOUR INVESTMENT PROFESSIONAL BEFORE MAKING ANY INVESTMENT DECISION

May 29, 2024 | The Most Splendid Housing Bubbles in America, April 2024 Update. Biggest Price Drops from 2022 Peak in San Francisco, Seattle, Phoenix, Portland, Denver, Las Vegas, Dallas

Wolf Richter


The S&P CoreLogic Case-Shiller Home Price Index, released today and dubbed “March,” is a three-month moving average of home prices whose sales were entered into public records in January, February, and March. So that’s the time-frame we’re looking at here. It reflects Rate-Cut Mania that commenced in November and peaked February 13, when the first of three nasty CPI reports in a row interfered.
During that time, the average 30-year fixed mortgage rate dropped from 7.8% at the end of October to about 6.6% in mid-February. Mortgage rates have since then zigzagged higher, with the daily measure of Mortgage New Daily pegging the average 30-year fixed rate mortgage today at 7.28%.
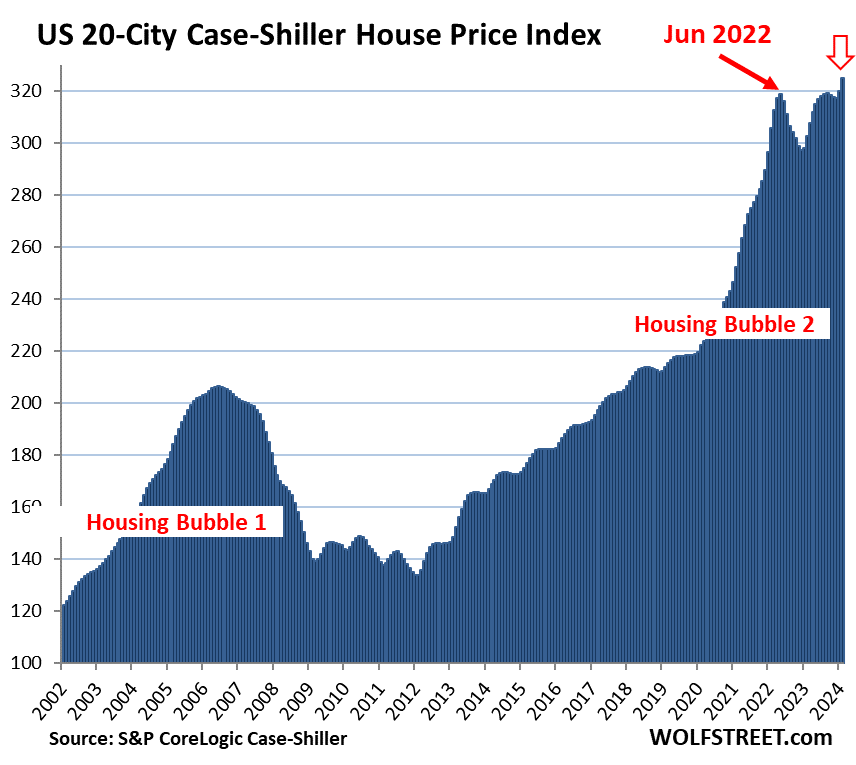
The 20-City Case-Shiller Home Price Index jumped by 1.6% in “March” (moving average of January, February, and March), from the prior month:
- Month-to-month, prices rose in all 20 metros covered by the index.
- Year-over-year, the 20-City Index was up 7.4%.
- Compared to the previous all-time high of June 2022, the index was up 2.0%.
- San Francisco Bay Area: -9.7% (May 2022)
- Seattle: -8.2% (May 2022)
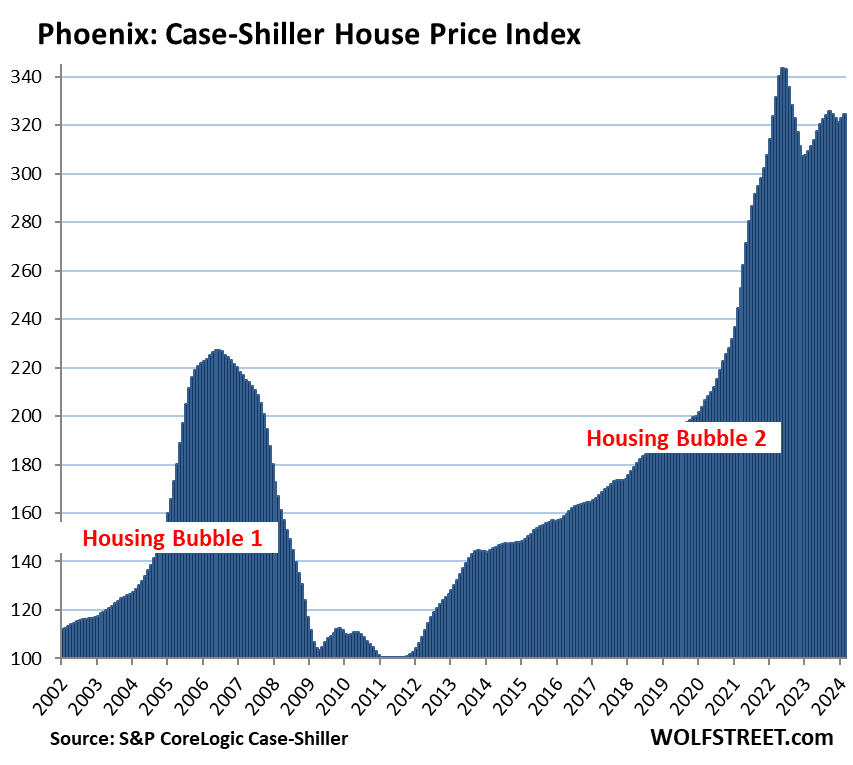
- Phoenix: -5.5% (June 2022)
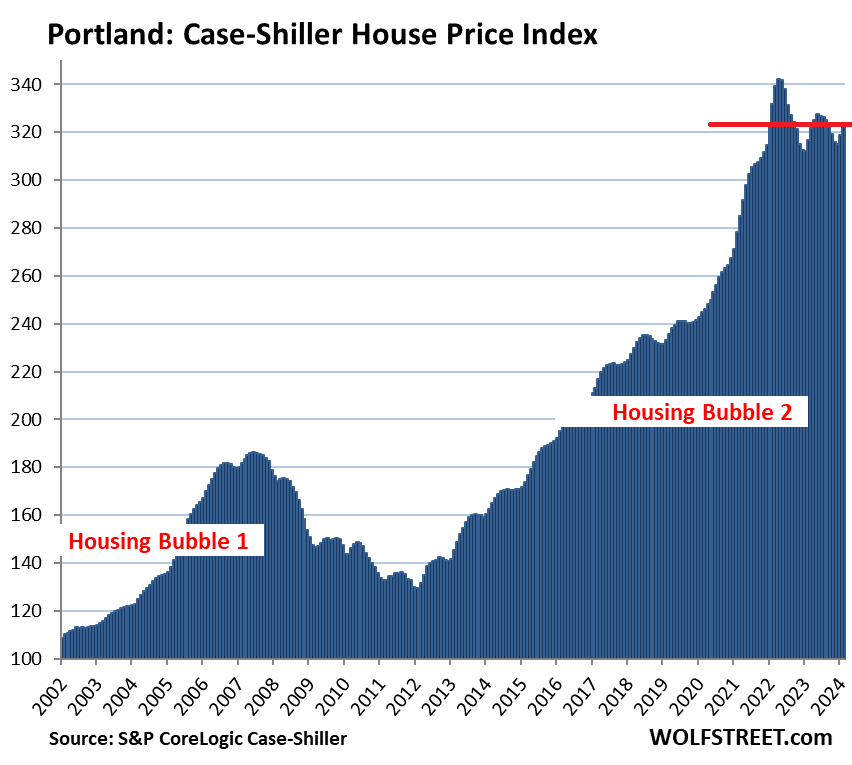
- Portland: -5.4% (May 2022)
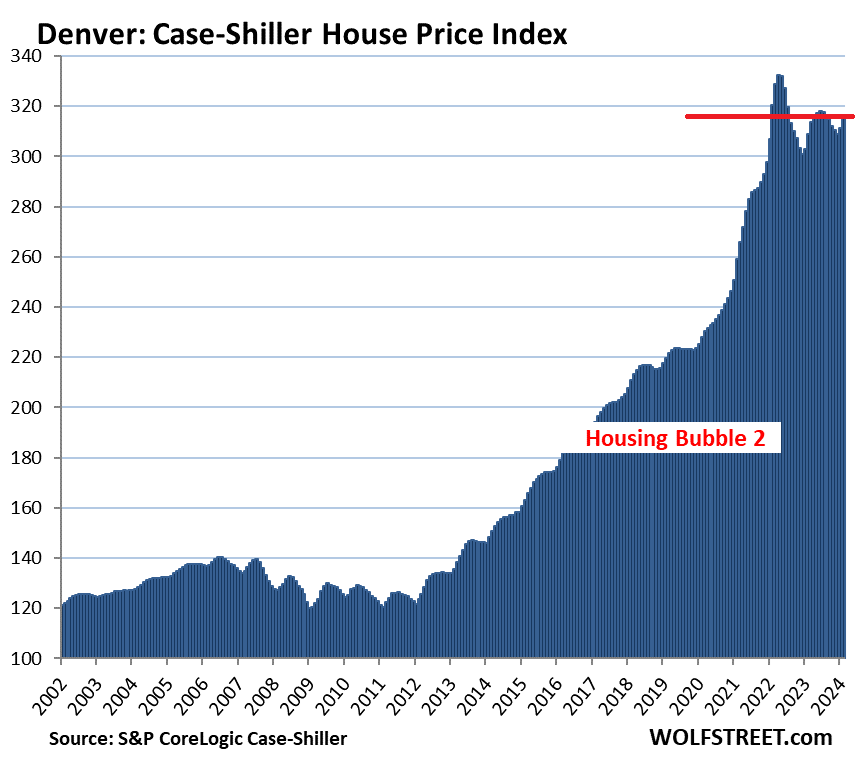
- Denver: -5.0% (May 2022)
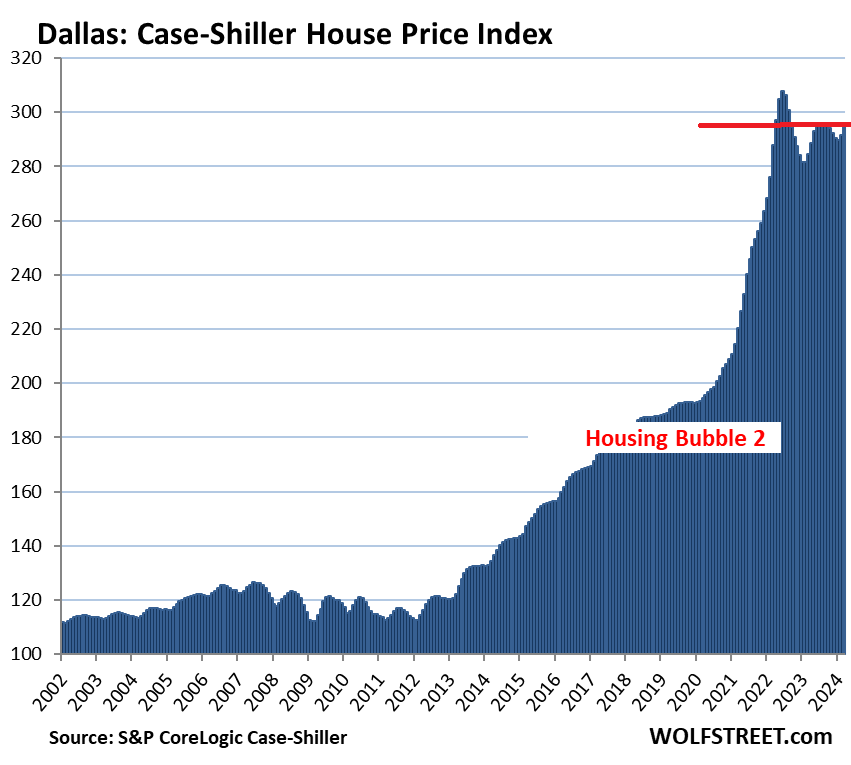
- Dallas: -4.2% (June 2022)
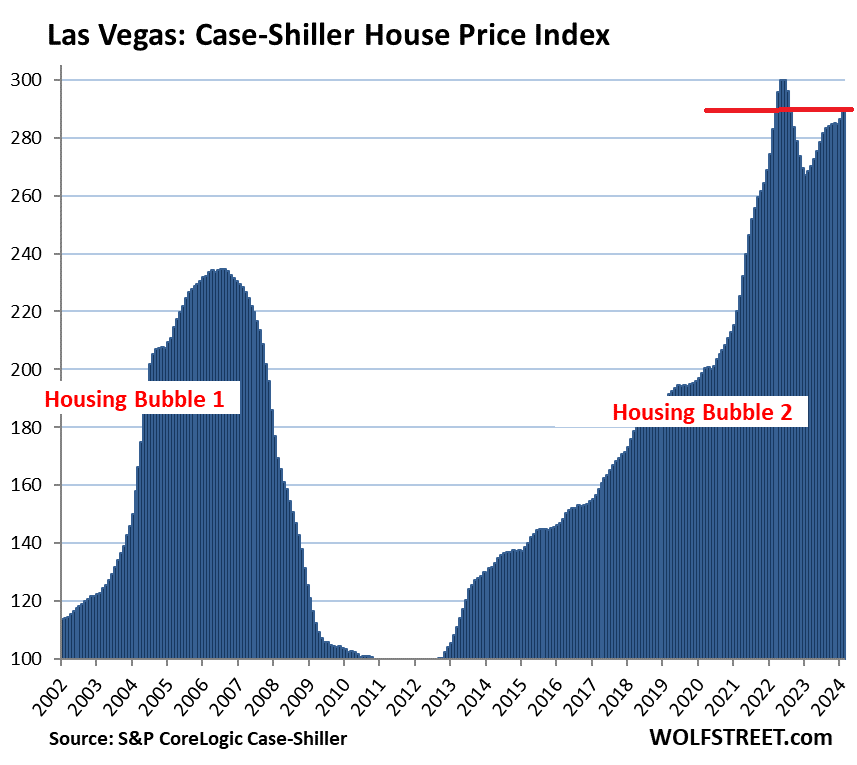
- Las Vegas: -3.6% (July 2022)
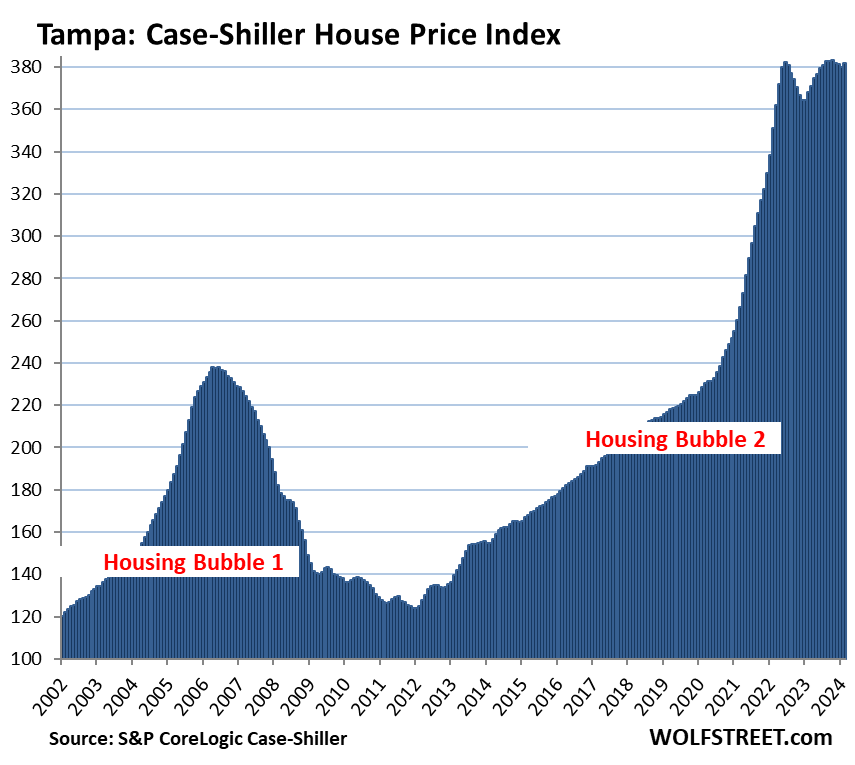
- Tampa: -0.14% (July 2022)
The most splendid housing bubbles by metro.
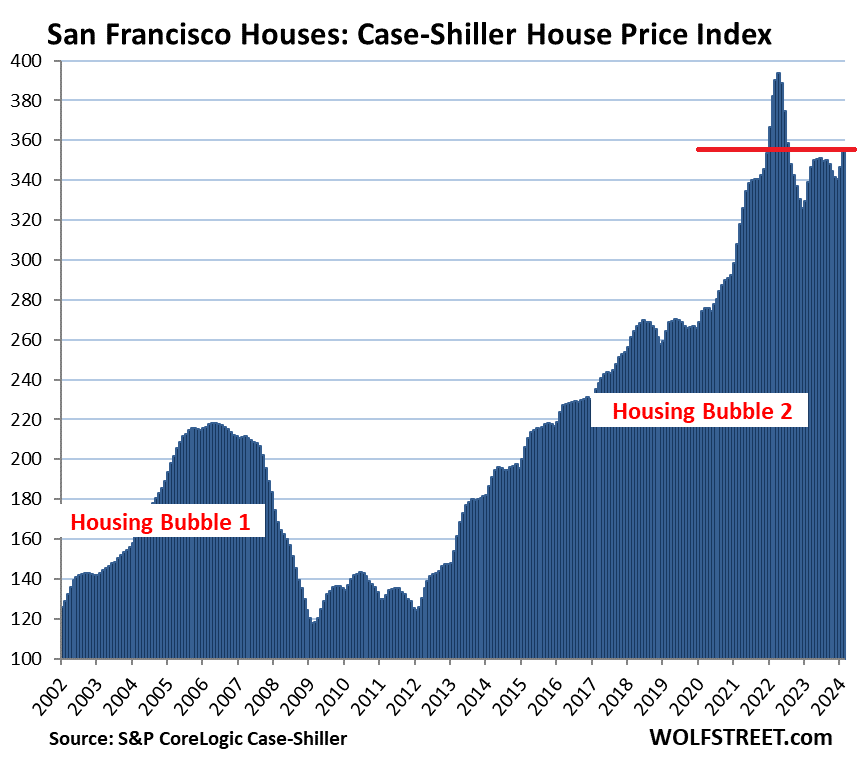
San Francisco Bay Area single family houses: the San Francisco metro in the Case-Shiller Index covers a five-county portion of the nine-county Bay Area (San Francisco, San Mateo, Contra Costa, Alameda, and Marin).
- Month to month: +2.6%
- Year over year: +4.9%.
- From the peak in May 2022: -9.7%.
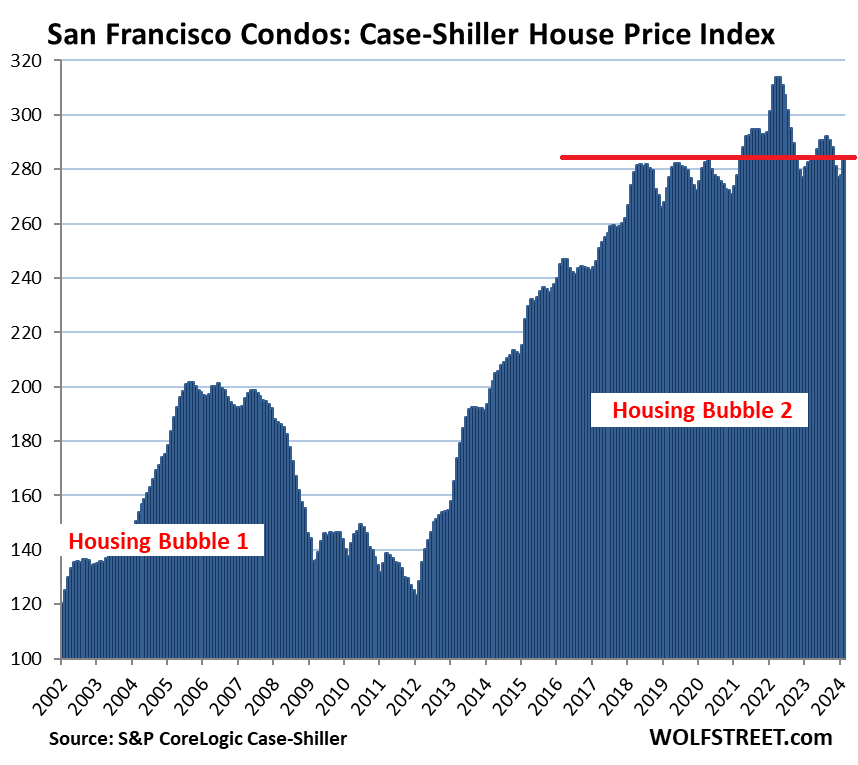
San Francisco Bay Area condos: Condos are a big part of the market in the Bay Area, particularly in San Francisco itself.
- Month to month: +2.2%.
- Year over year: +0.5%.
- From the peak in May 2022: -9.6%.
- Back to April 2018.
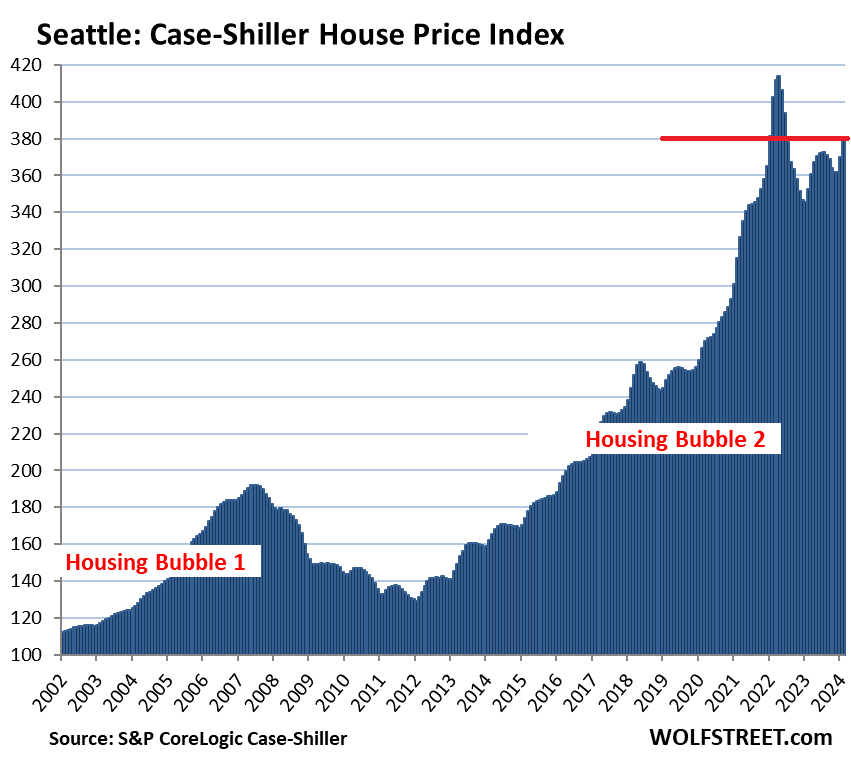
Seattle metro:
- Month to month: +2.7%.
- Year over year: +7.8%.
- From the peak in May 2022: -8.2%.
Phoenix metro:
- Month to month: +0.5%.
- Year over year: +4.9%.
- From the peak in June 2022: -5.5%.
Portland metro:
- Month to month: +1.5%.
- Year over year: +2.2%.
- From the peak in May 2022: -5.4%.
Denver metro:
- Month to month: +1.3%.
- Year over year: +2.1%.
- From the peak in May 2022: -5.0%.
Dallas metro:
- Month to month: +1.2%.
- Year over year: +3.6%.
- From the peak in June 2022: -4.2%.
Las Vegas metro:
- Month to month: +0.9%.
- Year over year: +7.7%.
- From the peak in July 2022: -3.6%.
Tampa metro:
- Month to month: +0.5%.
- Year over year: +3.8%.
- From high in November 2023: -0.14%.
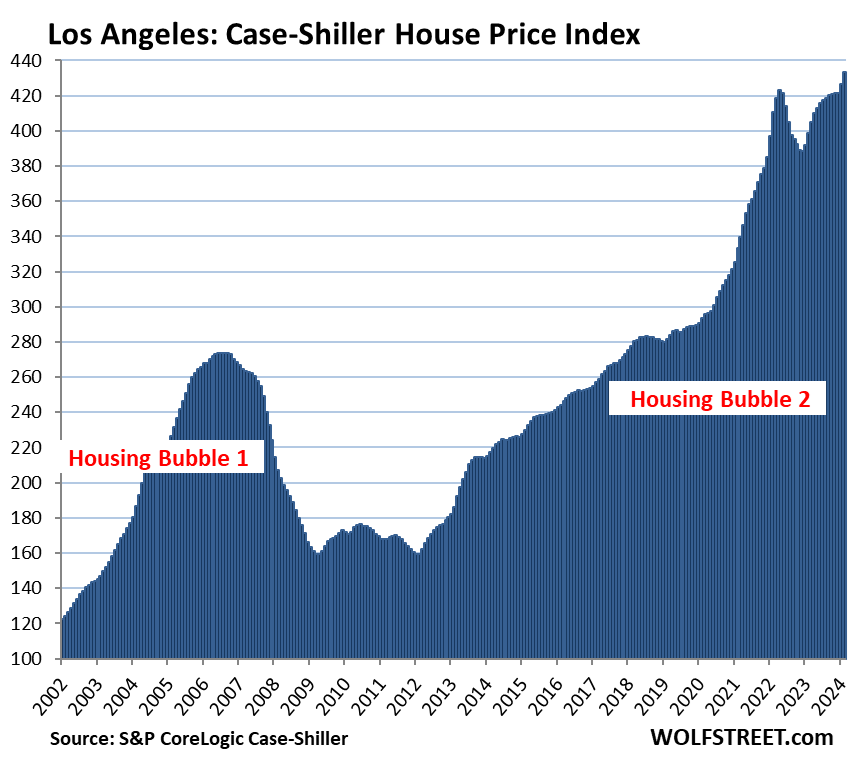
Los Angeles metro
- Month to month: +1.7%.
- Year over year: +8.8%.
- New high, 2.5% above the prior high in May 2022.
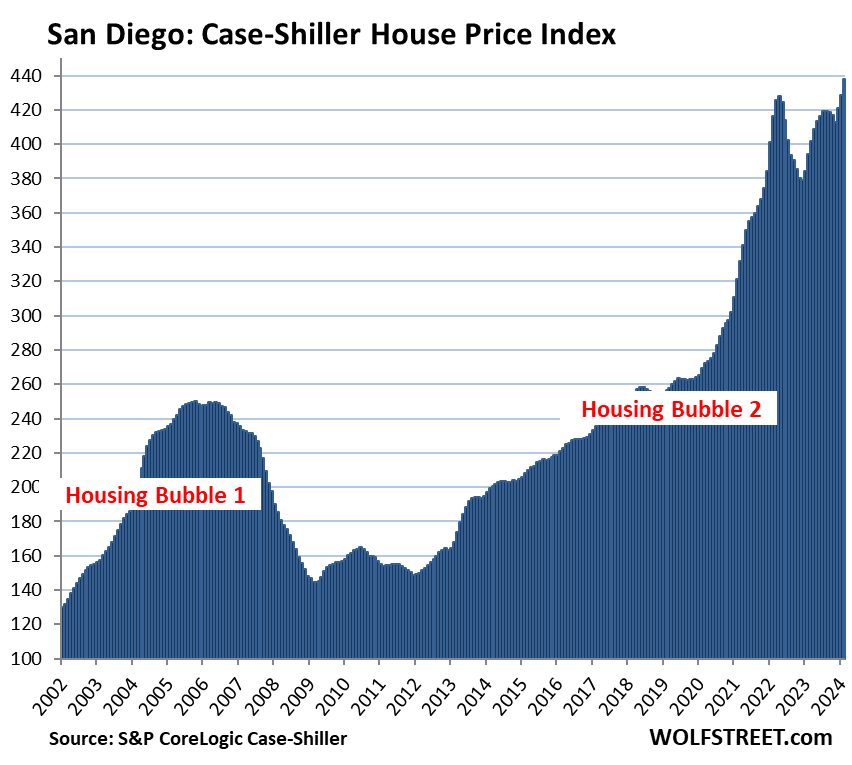
San Diego metro:
- Month to month: +2.2%.
- Year over year: +11.1%.
- New high, 2.4% above the prior high in May 2022.
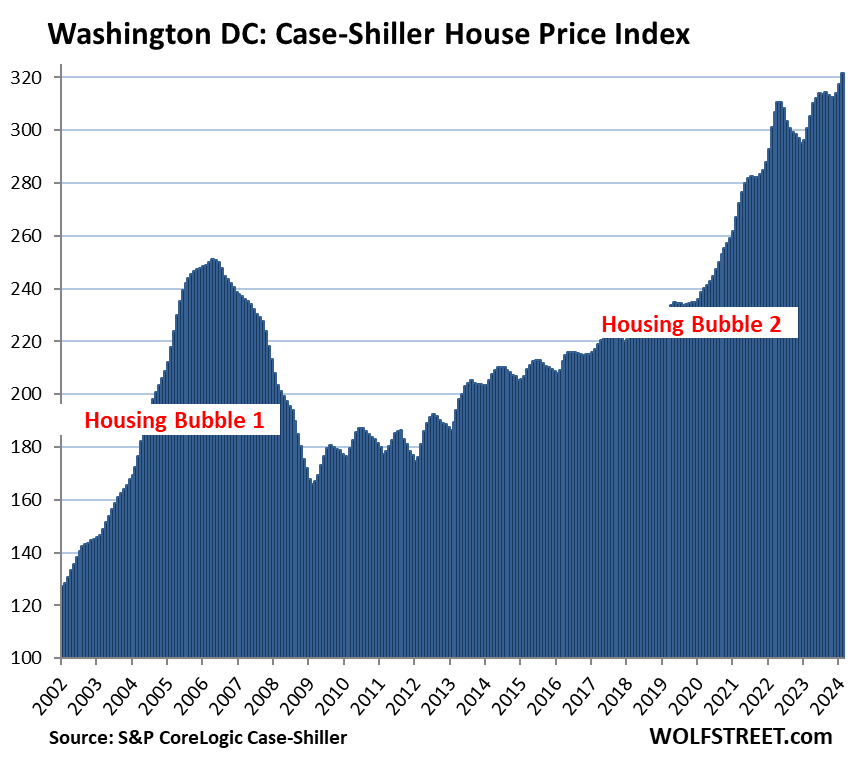
Washington D.C. metro:
- Month to month: +1.2%.
- Year over year: +7.0%.
- New high.
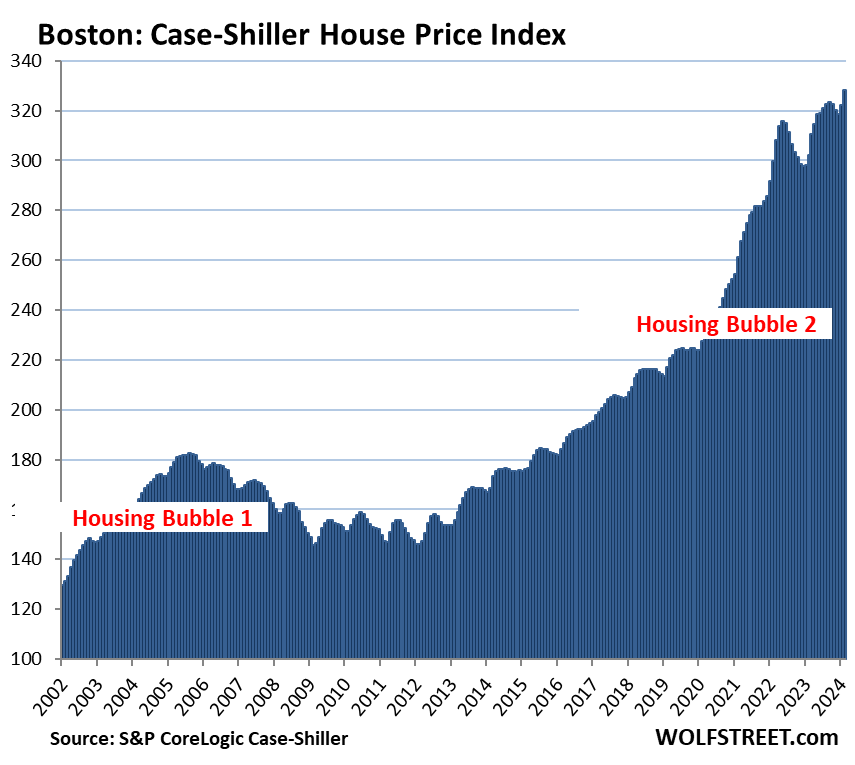
Boston metro:
- Month to month: +1.9%.
- Year over year: +8.7%.
- New high., +3.9% from June 2022.
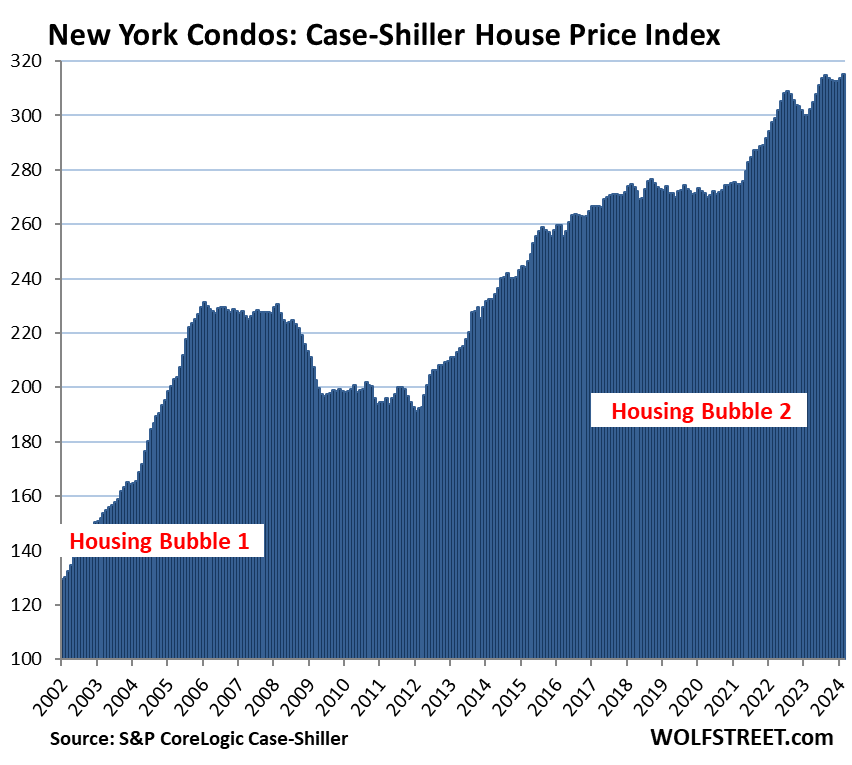
New York metro:
- Month to month: 1.5%.
- Year over year: +9.2%.
- Set new high.
Miami metro:
- Month to month: +1.0%.
- Year over year: +8.2%.
- New high.
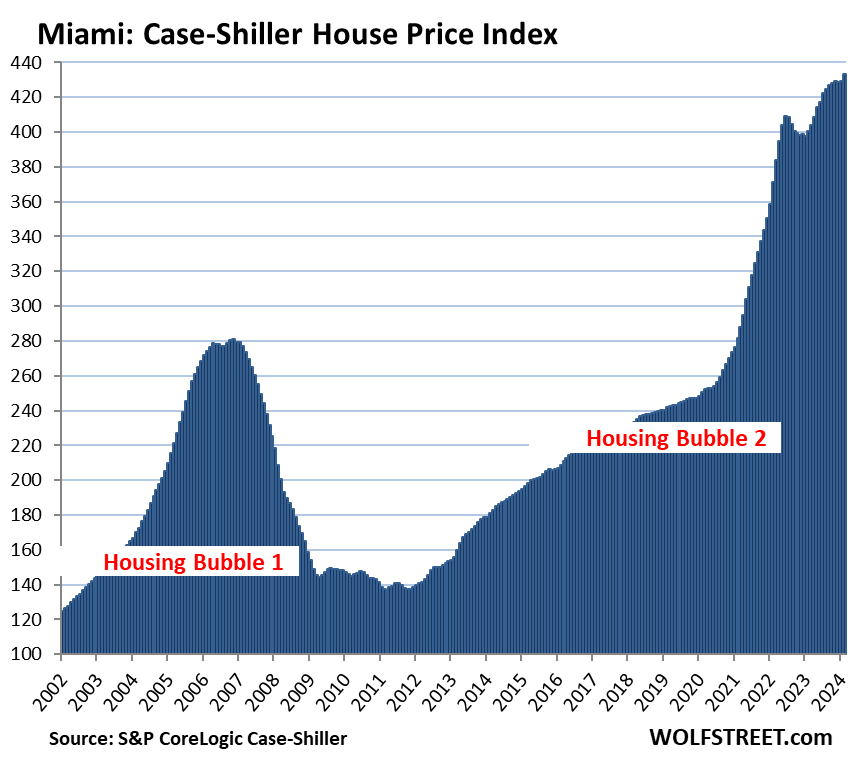
To qualify for the Most Splendid Housing Bubbles, the metro must have experienced home-price inflation since 2000 of about 200% or more at the peak. The indices were set at 100 for the year 2000. Today’s index value for San Diego of 438 is up 338% since 2000, making San Diego the most splendid housing bubble on this list, a hair ahead of Miami and Los Angeles.
Home-Price Inflation. By measuring how many dollars it takes to buy the same house over time via the “sales pairs” method, the Case-Shiller index is a measure of home-price inflation. San Diego had 338% home price inflation since 2000. Over the same period, the Consumer Price Index, which tracks prices of goods and services that consumers “consume,” rose 86%.
The remaining 6 of the 20 metros in the Case-Shiller index (Chicago, Charlotte, Minneapolis, Atlanta, Detroit, and Cleveland) had a lot less home-price inflation since 2000, despite the price spikes in recent years.
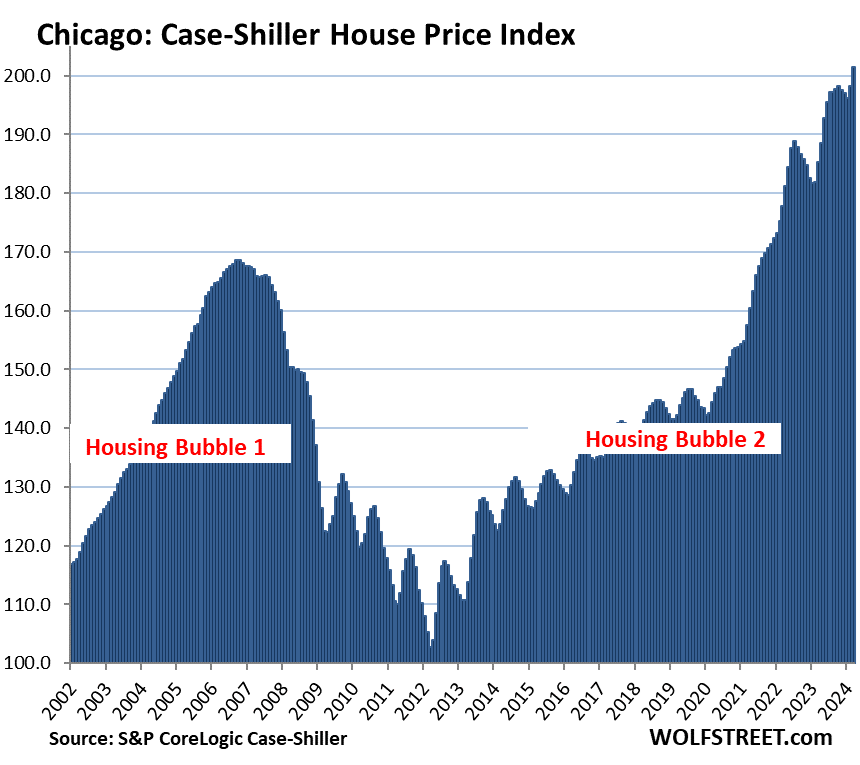
Chicago, with an index value of 201 is up by 101% from the year 2000, and therefore far from qualifying for this illustrious list of the Most Splendid Housing Bubbles. But the price spike in recent years was quite something, so here it is anyway:
- Month to month: +1.7%
- Year over year: +8.9%.
- New high.
Methodology. The Case-Shiller Index uses the “sales pairs” method, comparing sales in the current month to when the same houses were sold previously. The price changes are weighted based on how long ago the prior sale occurred, and adjustments are made for home improvements and other factors (37-page methodology, including the counties that are included in each metro).
STAY INFORMED! Receive our Weekly Recap of thought provoking articles, podcasts, and radio delivered to your inbox for FREE! Sign up here for the HoweStreet.com Weekly Recap.
Wolf Richter May 29th, 2024
Posted In: Wolf Street