January 4, 2024 | Navigating Market Crossroads
As an investment newsletter we strive to keep investors on top of what is driving the markets.
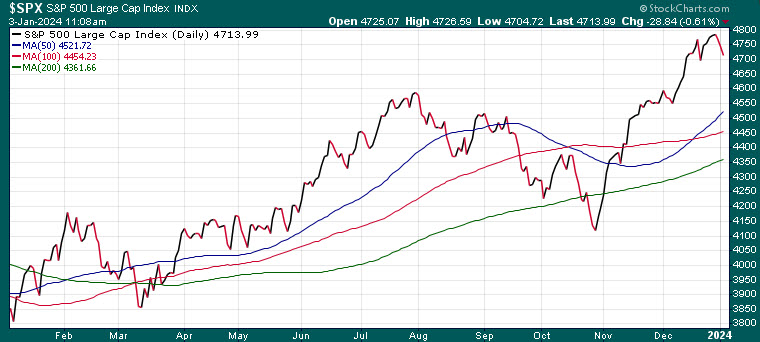
As we have been highlighting for Trend Letter subscribers the last few weeks, we are currently well-positioned for a potential pullback in the S&P. The developments in yesterday and today’s price action has increased the likelihood of such an event. As we have highlighted there are a number of indicators flashing warnings that a correction is due::
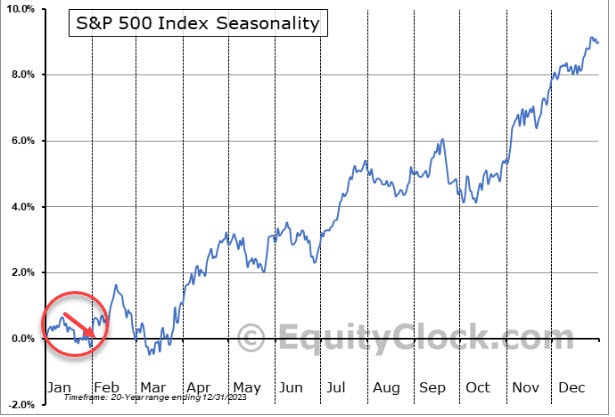
Seasonality:
The S&P 500 has almost perfectly followed the seasonal trend in 2023 and if this continues, then a pullback around now till the end of January is likely.
Fear & Greed:
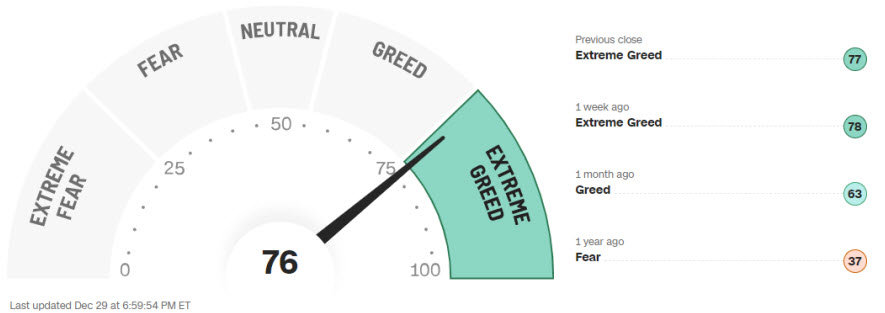
The Fear & Greed Index serves as a tool for assessing stock market dynamics and evaluating the fairness of stock prices. The underlying principle is rooted in the idea that an abundance of fear tends to push down stock prices, while an excess of greed tends to exert the opposite influence, driving prices higher.
As sentiment reaches extreme levels, it often undergoes a swing from one extreme to the opposite. Over the past few weeks, sentiment has been consistently characterized by Greed and has now escalated to Extreme Greed, indicating a potential shift in the opposite direction.
Overexposure:
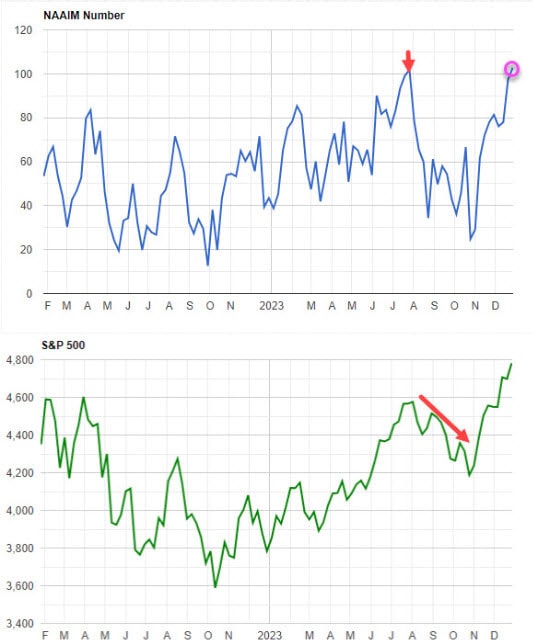
Another indicator that we published last week for subscribers is the NAAIM Exposure Index which represents the average exposure of fund managers. In October, fund managers were less than 25% exposed to the S&P 500. Today they are over 100% exposed, employing leveraged long strategies. The last time were saw this extreme bullish sentiment was back in July (top arrow) where we saw the start of a ~10% correction in the S&P 500 (lower red arrow).
Volatility:
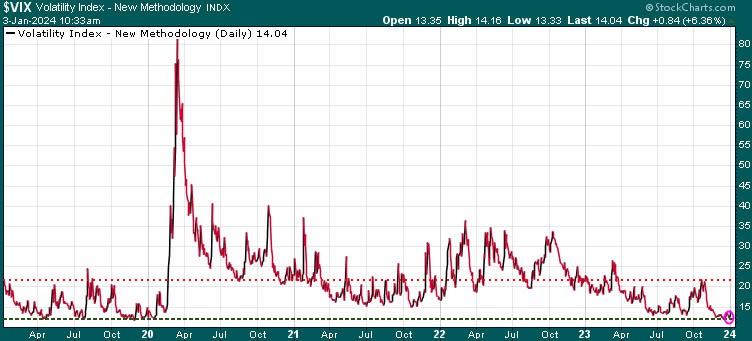
Another signal of caution comes from the VIX Volatility Index. The VIX serves as a metric indicating investors’ expectations regarding near-future stock market fluctuations. Commonly known as the ‘fear gauge,’ the VIX tends to climb in response to heightened uncertainty or fear in the market. Recognized as a contrarian indicator, it often suggests a potential reversal when reaching extreme levels. Presently, the VIX has lingered at historically low levels, signaling an exceptionally bullish sentiment in the markets. However, when sentiment becomes extremely bullish, it implies a dearth of buyers, often indicative of an impending correction.
While we expect a correction in the early to mid-January, we will be looking to play such a downward move as a buying opportunity. The year 2024 being an election year in the United States adds an interesting dynamic. Historical patterns suggest that stock market performance tends to improve during election years. This improvement is often linked to the incumbent’s capacity to boost investor enthusiasm through strategic initiatives, such as substantial spending, particularly targeted at significant voter segments like millennials today.
What to watch for:
The US dollar rallied strongly from July until October followed by a decline since October, coinciding with a decrease in bond yields. This decline has notably benefited equities. However, the trend appears to have become overextended, prompting a test of the downtrend line for the US dollar. If a breakthrough occurs, it could lead to, at least, a temporary rally in the US dollar, negatively impacting stocks (especially in the tech sector), bonds, precious metals, base metals, and other commodities.
To validate these expectations, we will be monitoring the following indicators:
- A VIX Volatility rally surpassing 20
- Fear & Greed Index entering the Fear range
- NAAIM Index dropping below 60
- S&P 500 testing 50-DMA at 4621, followed by the 100-DMA at 4454, and potentially the 200-DMA at 4361
If we hit these targets, then it could set up a great buying opportunity. Trend letter subscribers receive all BUY & SELL signals.
The forecasts could potentially be bleaker. Escalation of conflicts in the Middle East, tensions between China and Taiwan, and other unforeseen events are factors that could exacerbate the situation. It’s advisable to keep a close eye on your SELL Stops.
Stay tuned!
STAY INFORMED! Receive our Weekly Recap of thought provoking articles, podcasts, and radio delivered to your inbox for FREE! Sign up here for the HoweStreet.com Weekly Recap.
Martin Straith January 4th, 2024
Posted In: Howestreet


