September 5, 2023 | Recession Watch: Obscure But Scary

Well-known economic indicators like consumer debt, money supply growth, and the inverted yield curve have been painting an ominous picture for a while now. But they’re not alone. A bunch of obscure but highly predictive metrics are saying the same thing. Among them:
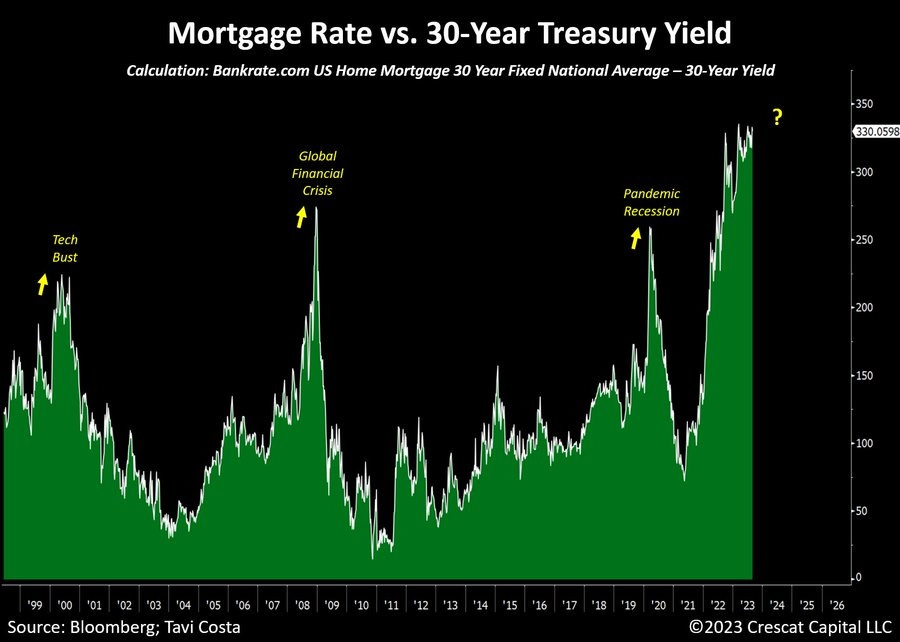
Spiking Mortgage/Treasury spread
30-year Treasury bonds and 30-year mortgages are loans with the same maturity but different borrowers. In good times — when jobs are plentiful and home prices are rising — mortgages are thought to be almost as safe as loans made to the US government, so the spread between the two interest rates narrows.
But when things get dicey, lenders start to worry about mortgage defaults and demand higher yields on home loans. Mortgage rates rise relative to Treasury bonds, and the spread widens. So a spike in this spread tends to signal the approach of hard times. The following chart shows how this worked in 1999, 2007, and during the pandemic flash crash of 2000. And now this spread is at a post-WWII high, indicating trouble dead ahead.
Negative DGPplus
Gross Domestic Product (GDP), a measure of how much the citizens of a country spend in a given year, is the generally accepted definition of an economy’s size. A similar but less famous metric called Gross Domestic Income (GDI) measures the amount of income generated by the above spending. Normally these two numbers track each other pretty closely. But sometimes they diverge. Lately, for instance, GDI has been shrinking while GDP has been growing.
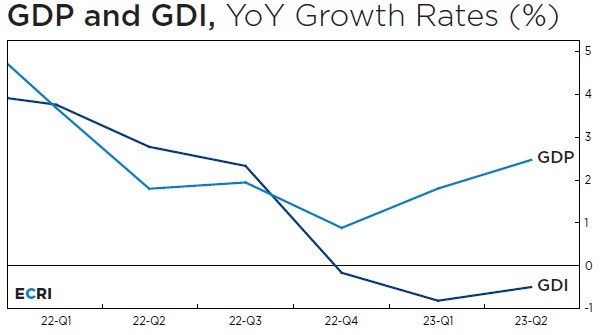
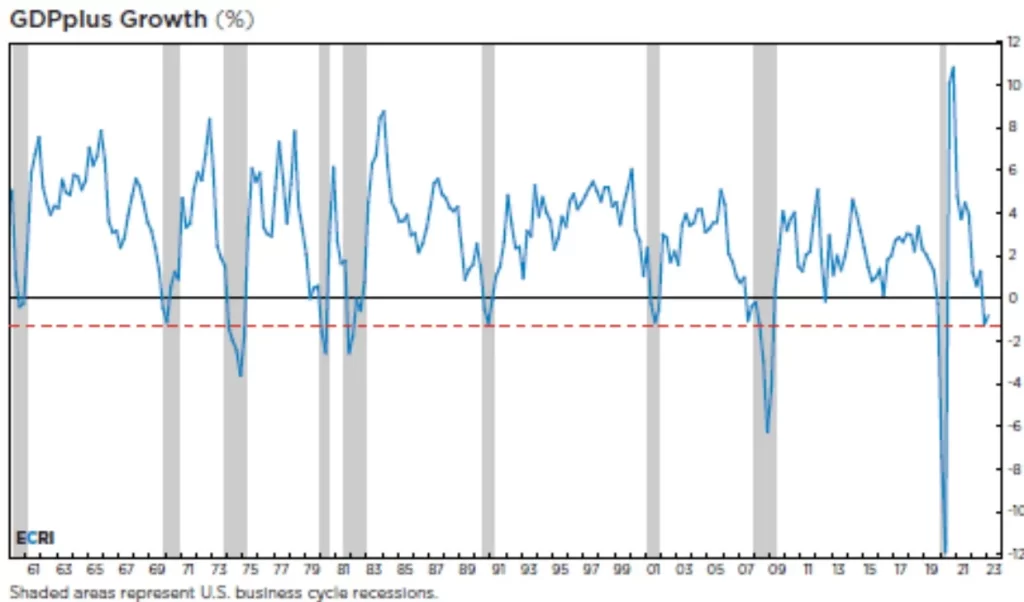
The Philadelphia Fed combines GDP and GDI to yield GDPplus – which appears to be a better recession indicator than either of the former. The following chart shows GDPplus going negative just as recessions start, all the way back to the 1960s. In late 2022, it went negative again.
Plunging Investor home purchases
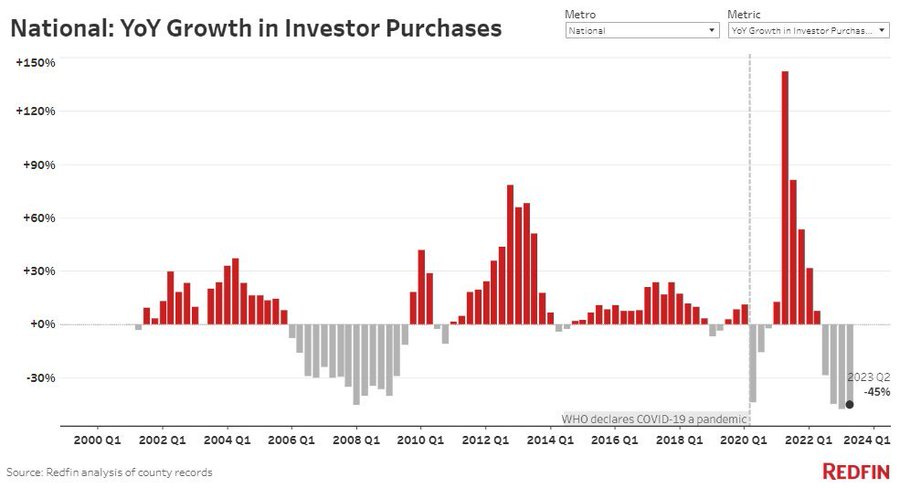
The health of the housing market is normally judged by the number of houses sold and prices paid. But within this broad sector, different groups are sometimes doing especially interesting things. Investors, for instance, are people who buy houses with the intention of either flipping them for a higher price, renting them out to generate cash flow, or just leaving them empty as a place to stash spare capital. Their activity says a lot about expectations for prices and rents.
From 2010 to 2021 (with the exception of pandemic-lockdown 2020), investors were mostly optimistic. But in 2022 they just gave up. Year-over-year buying is down by almost half, implying that the long period of rising prices and rents is over. The next stage is panicked investors dumping their inventory for whatever the market will pay.
Collapsing excess household savings
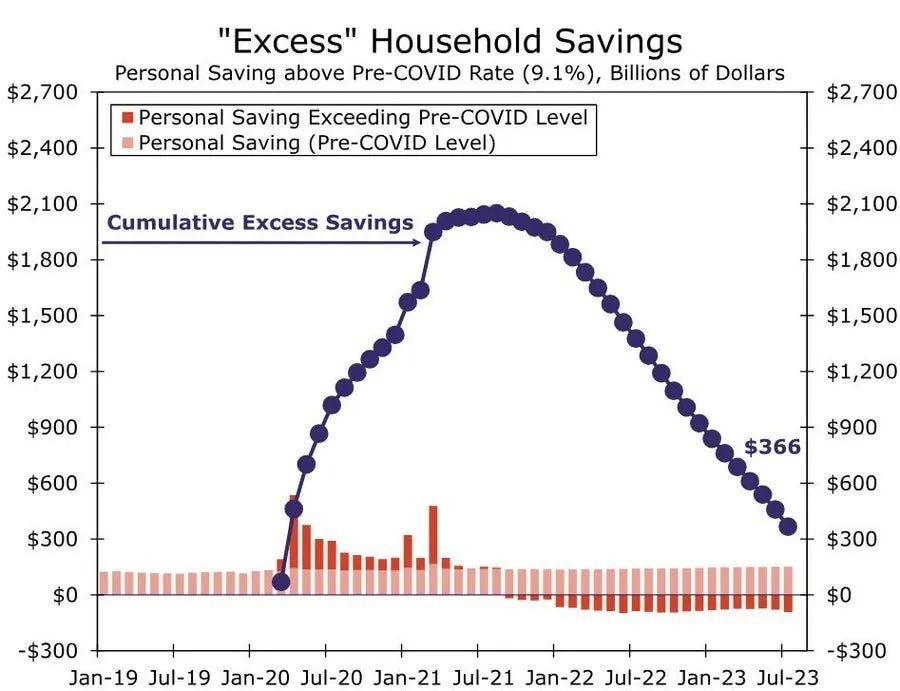
When the pandemic hit, traumatized Americans stopped spending and started saving their stimmy checks and whatever else came in. Economists call the amount of cash that built up beyond pre-pandemic levels “excess household savings,” and estimated the total at $2.1 trillion by late 2021.
This cash cushion is why consumer spending and economic growth have exceeded expectations so far in 2023. But now it’s almost gone. Excess household savings have fallen for 23 straight months, as tapped-out consumers continue to live beyond their paychecks. There’s less than $300 billion left, and that will evaporate in another couple of months — just as student loan payment obligations resume.
It’s coming …
Not that we really need any more indicators of an approaching slowdown, but jeez. No matter how you slice and dice the numbers, 2024 is looking like a year when a whole flock of chickens comes home to roost.
The takeaway: Be careful. If past is still prologue, 2024 might be 2008-level ugly. Which means lots of bargains for investors with the cash to take advantage.
STAY INFORMED! Receive our Weekly Recap of thought provoking articles, podcasts, and radio delivered to your inbox for FREE! Sign up here for the HoweStreet.com Weekly Recap.
John Rubino September 5th, 2023
Posted In: John Rubino Substack


