ALWAYS CONSULT YOUR INVESTMENT PROFESSIONAL BEFORE MAKING ANY INVESTMENT DECISION

July 11, 2023 | Yields Testing Resistance (and Nerves)

Danielle Park


The Visual Capitalist chart below shows the pace (in months) and percentage points of Fed hiking cycles since 1988 and confirms that the 2022-23 cycle (in yellow) has, by far, been the sharpest in at least 35 years.

In the process, interest-sensitive assets–commodities, bonds, equities and real estate–have all sold off.
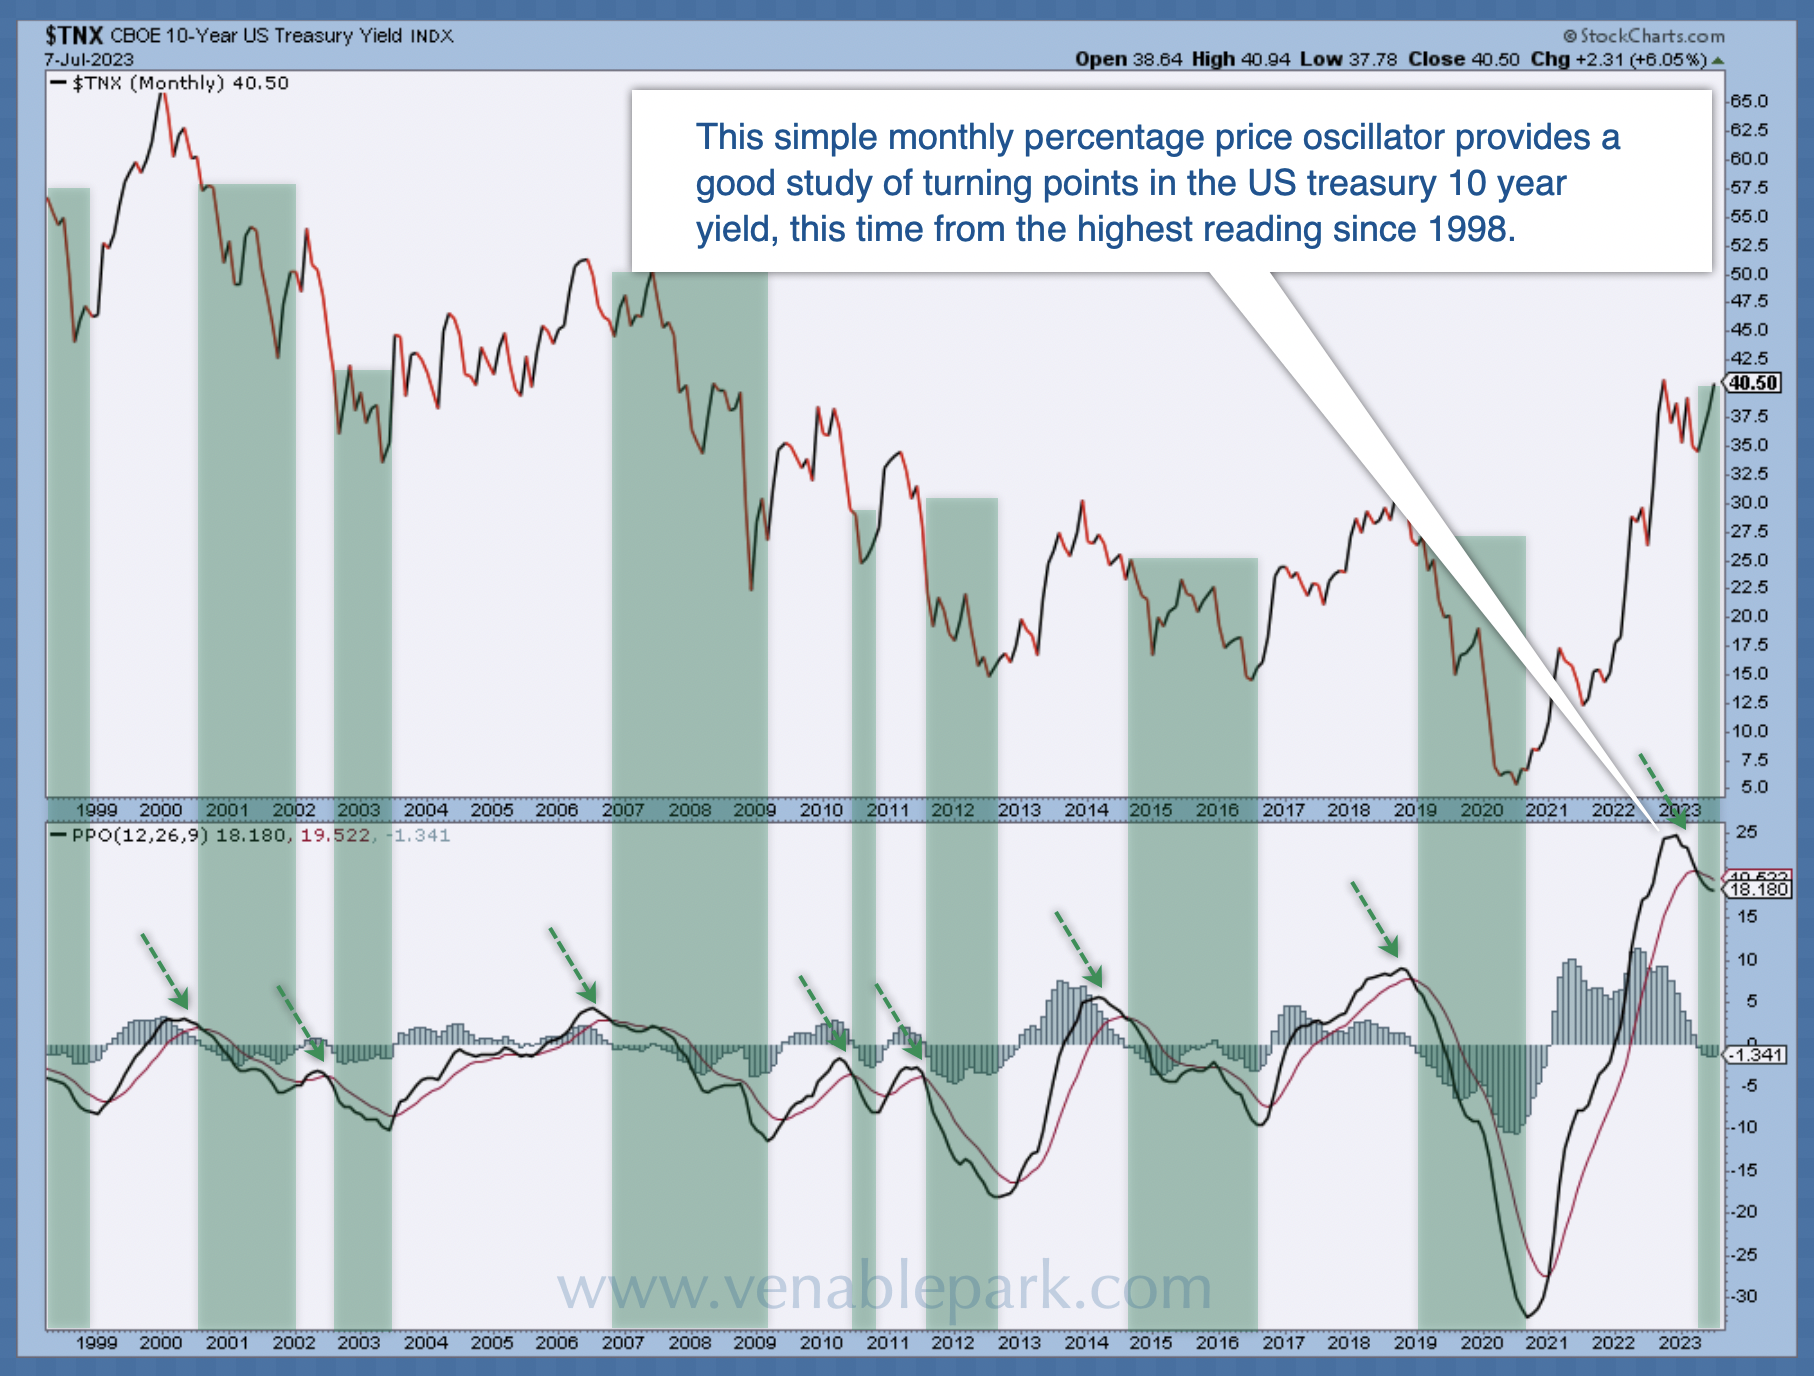
In the last week, the US 10-year Treasury yield tested 4% for the eighth time in 15 years. Is 4% the 10-year peak this cycle? As shown below, since 1998, courtesy of my partner Cory Venable, prior yield spikes of lesser magnitude have been followed by financial shock, economic weakness and falling treasury yields/rising government bond prices for many months afterwards (green bars).
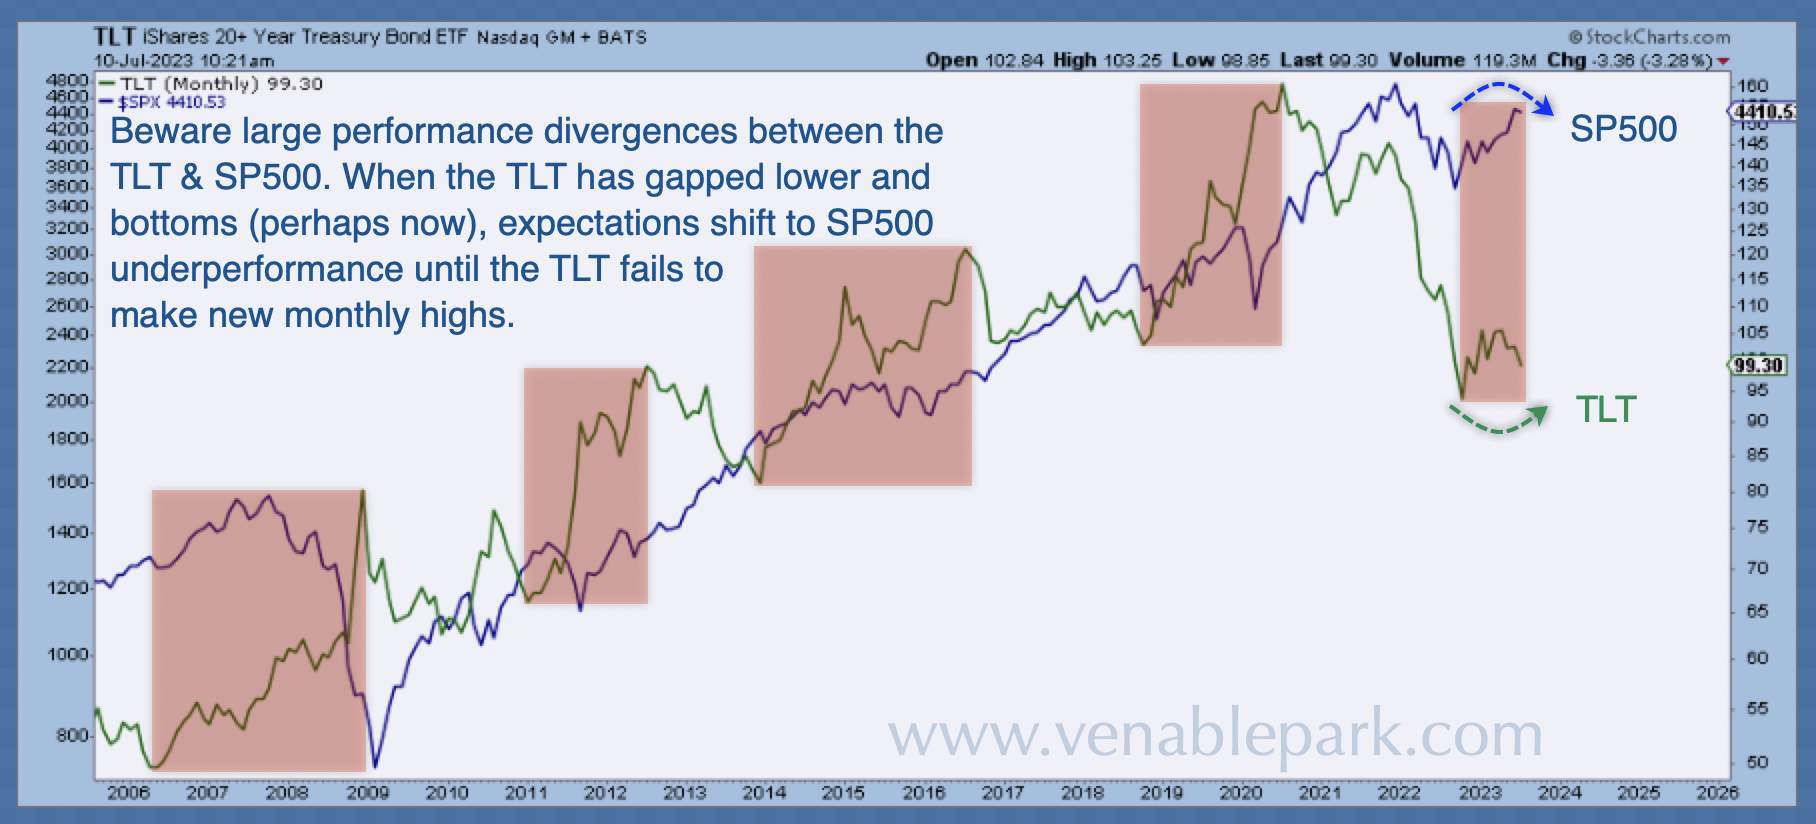
Stocks (S&P 500 below in blue since 2005) have traditionally tumbled when the price of the US 20-year Treasury bond (in green) rises (yields falling), and the gap between stock and treasury prices today is the largest we have seen in at least 20 years. This suggests that when treasury bonds next rebound, their upside and downside for equities are larger than average.
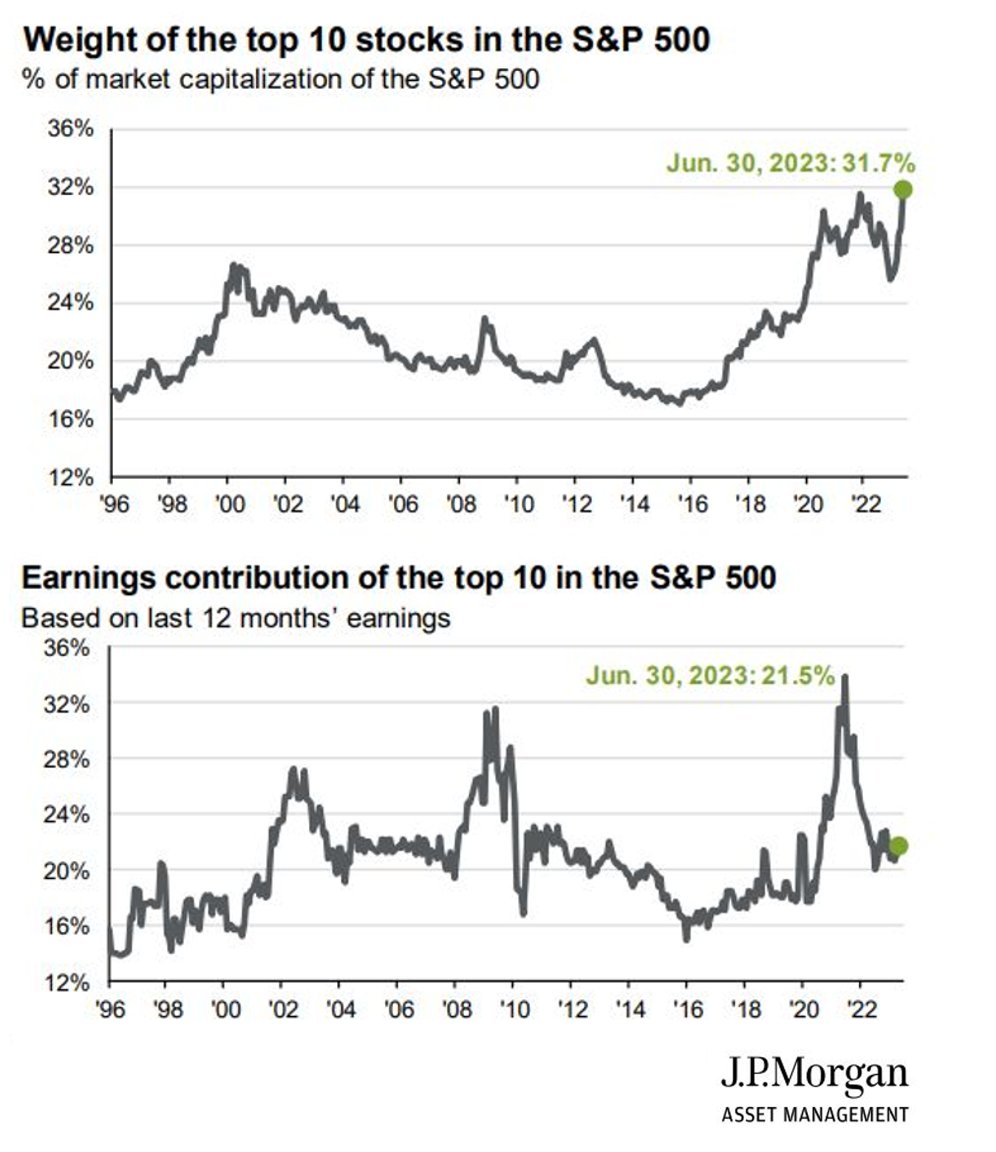
Even worse than the 2000 top (S&P 500 top chart below since 1996 ), stock market risk has been magnified this cycle by a whopping 31% concentration in the ten most expensive companies–mainly in the tech space. These ten have driven the bulk of index rebounds since last October, even as their earnings contribution has tumbled (lower chart). #irrationalexuberance. Most other companies and sectors remain flat and negative year-t0-date. Like other cycle tops, the worst market losses typically unfold as the last leaders finally stumble.
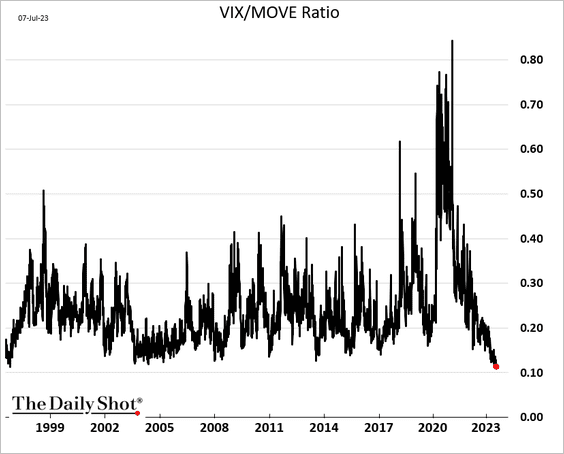
The extremely suppressed equity market volatility (VIX) versus high Treasury rate volatility (MOVE index) below since 1997, courtesy of the Daily Shot, is screaming for mean reversion. The beachball of equity volatility is never held down indefinitely.
We can never know when equity markets will recover cycle highs. They don’t come with due dates, and most individual companies ultimately fail, taking shareholder and lender capital with them. History warns that after manic valuation peaks, even the companies that endure typically spend years before reclaiming their prior highs. This is why buying corporate securities at low valuations is so critical when their risk/reward prospects are most favourable. Ben Graham called this margin of safety.
Government bonds have been a rough ride since 2021. Still, unlike the rest, they have the lowest odds of default, prescribed interest rates, return of capital dates and appreciate as bear markets drive risk-fleeing capital toward them.
Today’s setup for the highest quality bonds (yield plus capital gain prospects) is the most favourable in decades.
STAY INFORMED! Receive our Weekly Recap of thought provoking articles, podcasts, and radio delivered to your inbox for FREE! Sign up here for the HoweStreet.com Weekly Recap.
Danielle Park July 11th, 2023
Posted In: Juggling Dynamite