September 3, 2022 | Trading Desk Notes For September 3, 2022

Demand destruction requires higher for longer.
The DJI is down >2,000 points since Powell made it “perfectly clear” in his August 26 Jackson Hole speech that the Fed is determined to do “whatever it takes” to bring inflation back down to 2%, regardless of the combination of factors which caused it to rise substantially above the Fed’s target.
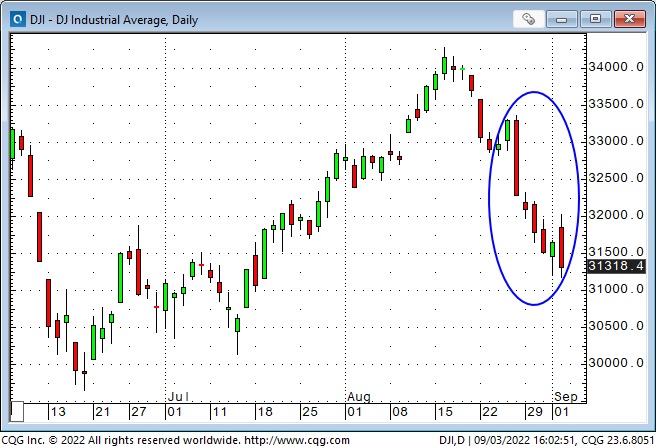
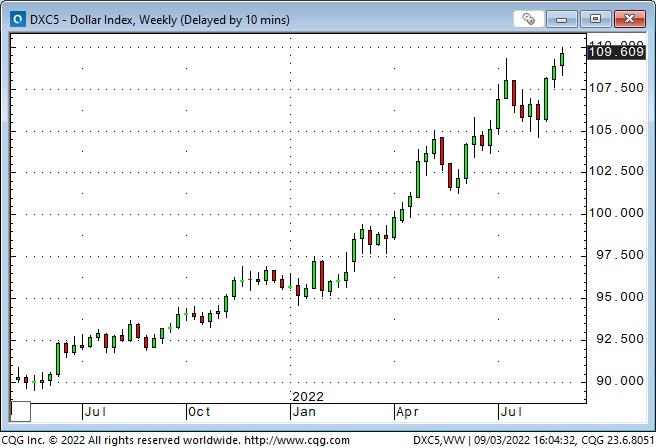
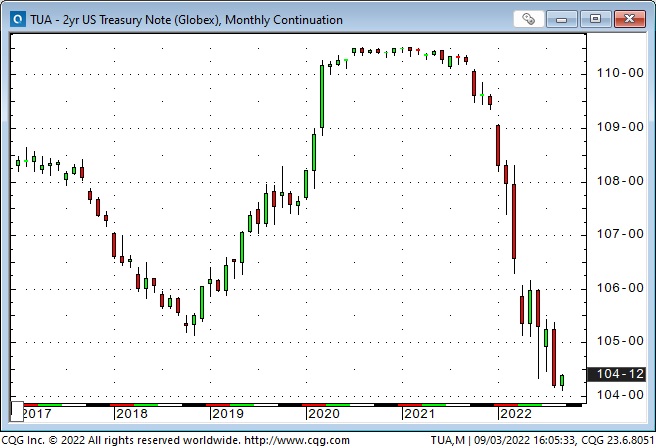
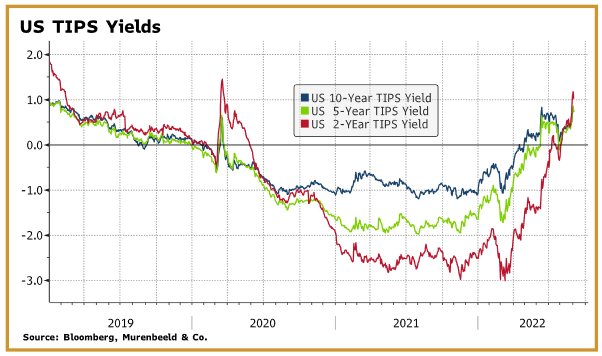
The market has acquired greater respect for the Fed’s resolve to continue tightening financial conditions in an attempt to crimp demand. As a result, the US Dollar Index has surged to new 20-year highs, interest rates are higher across the curve (the 2-year Treasury yield is at a 15-year high), and real rates have surged to their highest level in three years.
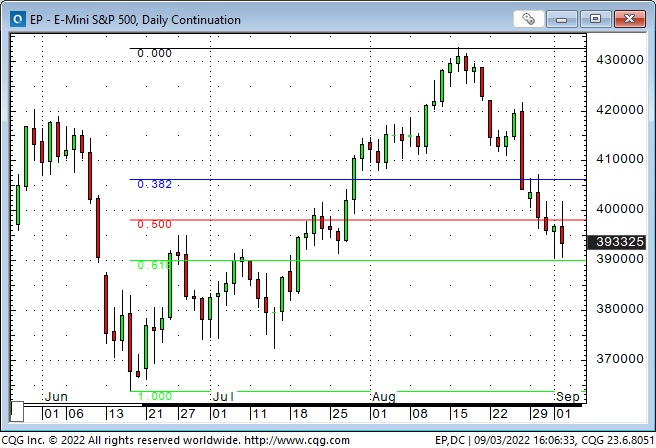
The leading American stock indices have all given back ~60% of the gains made during the mid-June to mid-August rally (when the prevailing sentiment was that “Peak Fed” had been reached at the mid-June FOMC meeting.)
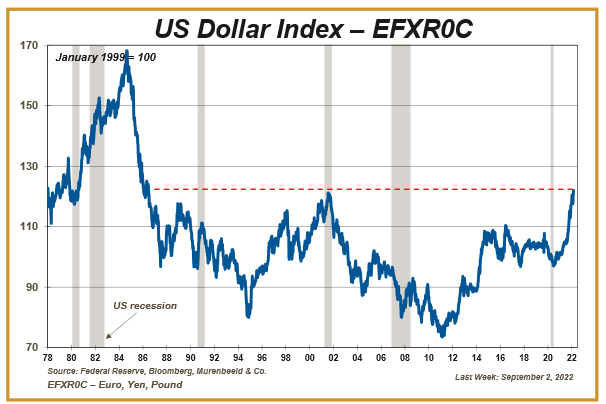
Currencies
The US Dollar has been smoking hot against virtually all currencies since the summer of 2021. The British Pound is at a 35-year low against the US Dollar, the Japanese Yen is at a 24-year low, and the Euro is at a 20-year low. Here’s a chart, courtesy of Martin Murenbeeld, of a USD Index, made up of only those three currencies. (The USD soared to the 1985 high during Ronald Regan’s first term – and on the back of Volker’s monetary policy.)
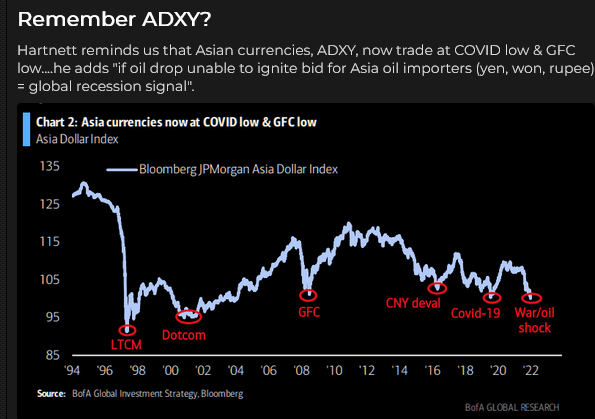
Here’s a chart of the ADXY – an index of Asian currencies – showing the USD’s pervasive strength. (The weakness of the Asian currencies helps Asian countries maintain substantial trade surpluses with the USA.)
The Canadian Dollar ended August at its lowest monthly close against the USD in two years. The primary driver of CAD weakness (since June 2021) has been the ultra-strong USD.
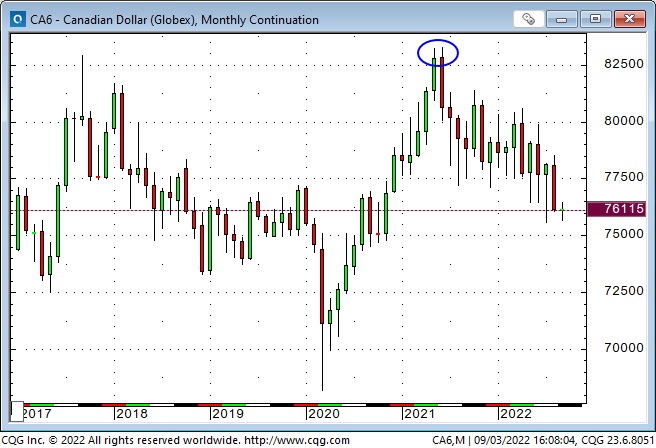
The CAD has a historically high correlation with commodities, which have been in an uptrend since April 2020, but since last June (when the CAD was at a 6-year high against the USD), the ultra-strong USD has trumped the CAD/Commodity correlation.
The CAD still gets a massive boost from strong commodity markets. The CAD is at a 10-year high against the Euro, a 14-year high against the Yen and a 37-year high against the British Pound.
First Signs of Monthly Exhaustion in the Dollar
My long-time friend and excellent technical analyst, Ross Clark, published a report this week noting that the USDX is starting September with an upside exhaustion alert. There have been five previous examples since 1970, and each time the USDX has made a minor top within a month, corrected, and then made new highs. I highly recommend Ross to my readers.
Gold
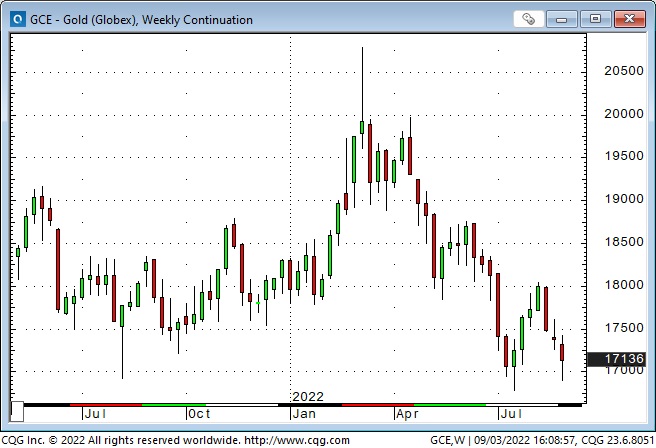
Gold has struggled despite the highest inflation in years, mainly because the USD and real interest rates have soared. The last time the TIPS yield was at current levels (March 2020), the gold price was ~$1,500. The last time the US Dollar Index (DXY) was at current levels (June 2002), the gold price was ~$300. Silver and GDX (the gold miners’ ETF) traded at >2-year lows this week.
Interest rates
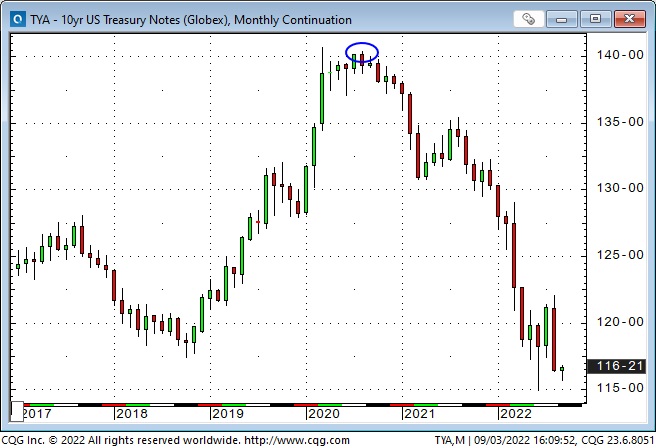
Bond yields registered historic lows in August 2020 (the 10-year yield hit a low of 0.50%), but yields have been rising sharply this year, with the 10-year yield hitting 3.25% this week – it briefly touched 3.5% in mid-June.
The 60/40 problem
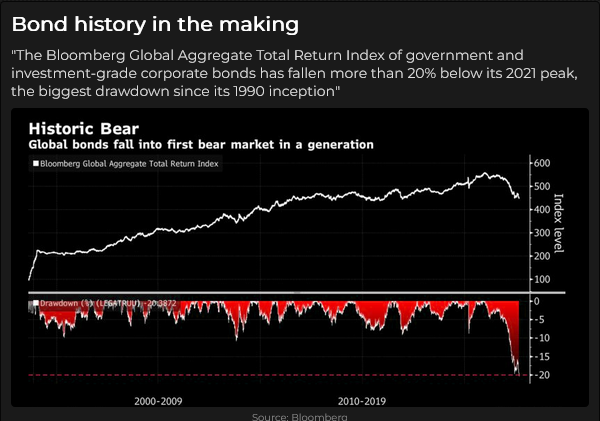
Stocks and bonds have been falling YTD, which is a problem for the classic 60/40 stock/bond portfolio. The Bank of America reports that the classic combo is down ~19% YTD – on track for the worst annual performance since 1936.
Energy
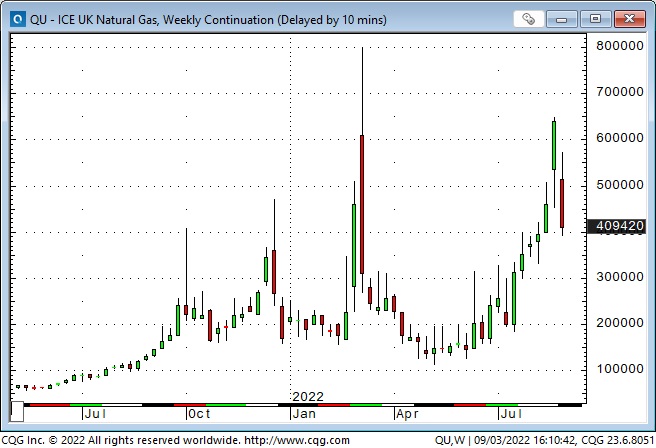
European Natgas futures, which had soared this summer, tumbled sharply this week.
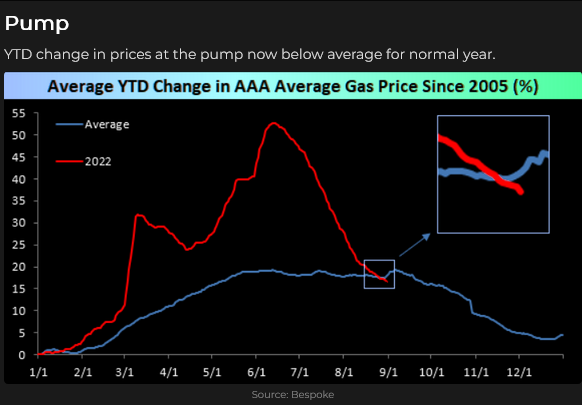
NYMEX gasoline futures hit All-Time Highs in June but have fallen >40% – trading this week at levels last seen before the Russian invasion of Ukraine.
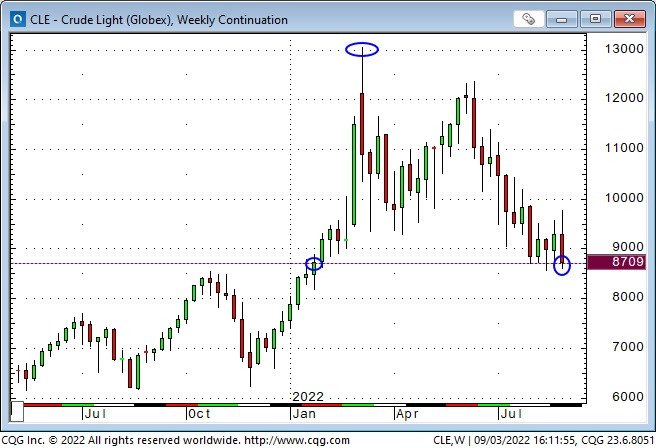
WTI crude oil futures closed this week at their lowest levels since January, down ~33% from the highs made immediately following the Russian invasion and subsequent Western sanctions against Russia.
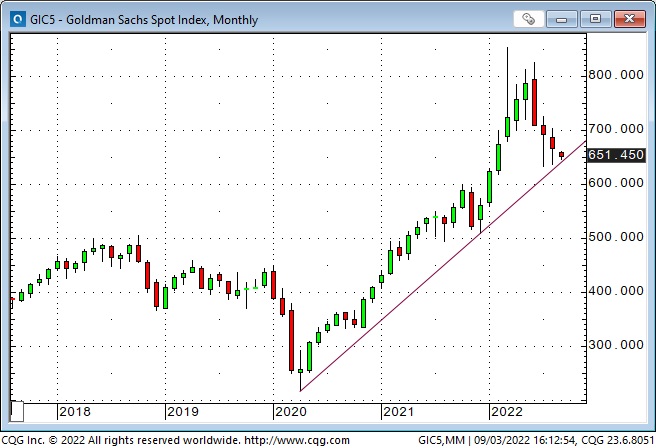
The (energy heavy) Goldman Sachs commodity index closed this week down ~24% from its March 2022 highs – right on the significant uptrend line from the 2020 lows.
Are energy shares historically cheap, relative to the broad market, even as energy itself is historically expensive? Perhaps (??) ESG mandates have restricted capital flows into the energy sector. (D’ya think?)
Last week I noted that Canada has the lowest Natgas prices in the world – mainly because we have no LNG export facilities. A subscriber sent me this link to a terrific article by David Yager, dated August 30, 2020, which takes an in-depth look at the Natgas market in Canada. It’s a 10-minute read and pulls no punches. I highly recommend it.
My short-term trading
I was long T-Notes at the end of last week and was stopped out of that position when the market re-opened Sunday afternoon. I bought the T-Notes a couple of hours after Powell’s Jackson Hole speech – noting that both the long and the ultra-long bond futures were green on the day. I took that to mean that the bond market saw Powell’s resolve to fight inflation as good for bonds, even if it meant pushing the economy into a recession. I was wrong – bond prices tumbled Monday to Thursday, and I was glad to have been stopped for a slight loss.
As bonds tumbled Monday to Thursday, so did the stock market – continuing the route that had begun last Friday following Powell’s speech. By Thursday’s low, the S+P futures were down >300 points from last Friday’s highs (the DJIA was down ~1,800 points), and when the market rallied back from Thursday morning lows and took out the (floor session) opening highs, I bought the S+P futures. I liked the “hammer” daily chart pattern in a highly oversold market.
The market continued to rally into Thursday’s close, and I kept my position – knowing that early Friday morning’s employment report could cause the market to make a big move – up or down.
The market was very volatile Friday morning following the report but continued higher, and by later that morning, my trade was ahead by ~70 points.
Given that the market had “digested” the employment report and had traded ~120 points above the Thursday lows, I raised my stop to a point where I thought, “if the market drops to here, after the big gains it made earlier today, I don’t want to stay long.”
Another influence on where I placed my stop was my desire to try to lengthen my trading time frames. Over the past few months, I felt I had been “pulled into” becoming a day trader because of the wild price swings across markets, but I wanted to get away from that. I thought I had a better “edge” with a swing trading time frame – a few days to a few weeks.
I did NOT raise my stop to a level that had any relationship to my entry point – I was not trying to ensure that, at worst, I would break even on the trade.
About three hours after the floor session began, the market topped and fell quickly. My stop was hit about two hours later, and the trade resulted in a slight loss. The market continued to drop as much as 115 points from the day’s highs (the “story” was that the Russians had indefinitely suspended Natgas exports to Europe), but it did not take out Thursday’s low.
I was frustrated with the loss and remembered my recent “rule” about taking quick profits if I was in a counter-trend trade (and staying with a trade if I was trading in line with the trend.) That rule seemed “at odds” with my desire to get away from day trading, so I overrode it to “stay with” the trade for longer.
I shrugged off the loss, remembering that years ago, a veteran trader had told me that markets try to teach you bad habits! (For instance, if you are tired of getting stopped and decide to quit using stops!)
When the market bounced off the intraday lows without taking out Thursday’s low, I re-established the position and kept it into the weekend.
On my radar
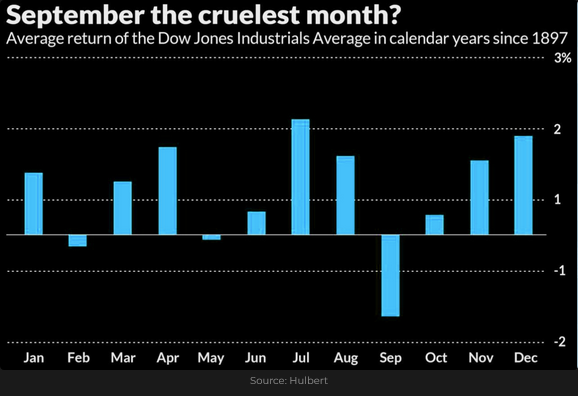
We’ve got a 3-day weekend, and many times over the years, I’ve seen markets come back with a BANG after Labor Day – meaning that we may see severe reversals of the “stories” and the “price action” from late summer.
I’ve been in a “semi-summer holiday” mode for two weeks, and I’m looking forward to trading more aggressively this fall!
The Barney report
Barney and I were in the ocean Wednesday. He was scheduled for his visit with the Vet on Thursday, and I expected he would be restricted from swimming for at least the next two weeks, so we took the opportunity to go for a swim!
We were on a giant sand bar in about three feet of water, so Barney needed to swim if I threw the ball for him to fetch. We stopped playing fetch for a minute, and Barney stood on his hind legs to look around. He held that position for a good minute – much to my amazement! He looked terrific standing there, and I didn’t have my cell to get a photo.
He developed a taste for blackberries on our recent forest walks. He will bite them off the vine but prefers if Papa picks them for him.
His surgery was routine, but instead of having to wear the “cone of shame,” the Vet gave him a one-piece suit to wear to keep him from licking the incision. My wife calls it a “muscle shirt,“ and Barney has taken it in stride!

A request
If you like reading the Trading Desk Notes, please forward a copy or a link to a friend. Also, I genuinely welcome your comments, and please let me know if you’d like to see something new in the TD Notes.
Listen to Victor talk about markets
I’ve had a regular weekly spot on Mike Campbell’s extremely popular Moneytalks show for >22 years. The September 3 podcast is available at: https://mikesmoneytalks.ca.
STAY INFORMED! Receive our Weekly Recap of thought provoking articles, podcasts, and radio delivered to your inbox for FREE! Sign up here for the HoweStreet.com Weekly Recap.
Victor Adair September 3rd, 2022
Posted In: Victor Adair Blog


